Figure 7.

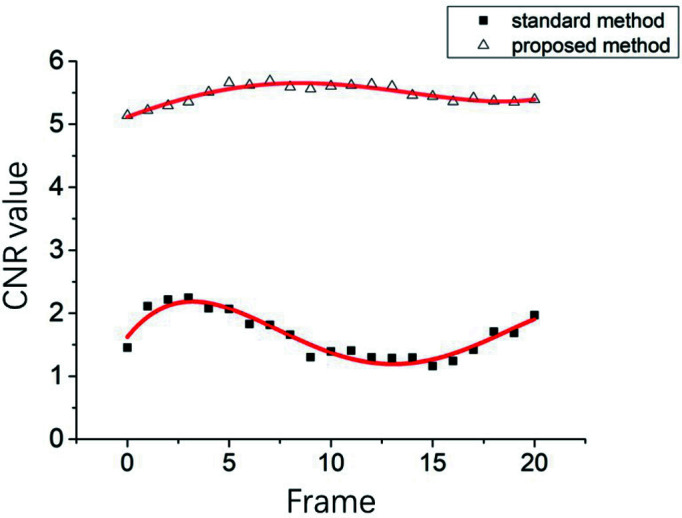
CNRs of the image sequence obtained continuously after the perfusion of contrast agent stabilized. The lower and upper curves correspond to the results obtained using the temporal subtraction method and proposed PTA method, respectively.

CNRs of the image sequence obtained continuously after the perfusion of contrast agent stabilized. The lower and upper curves correspond to the results obtained using the temporal subtraction method and proposed PTA method, respectively.