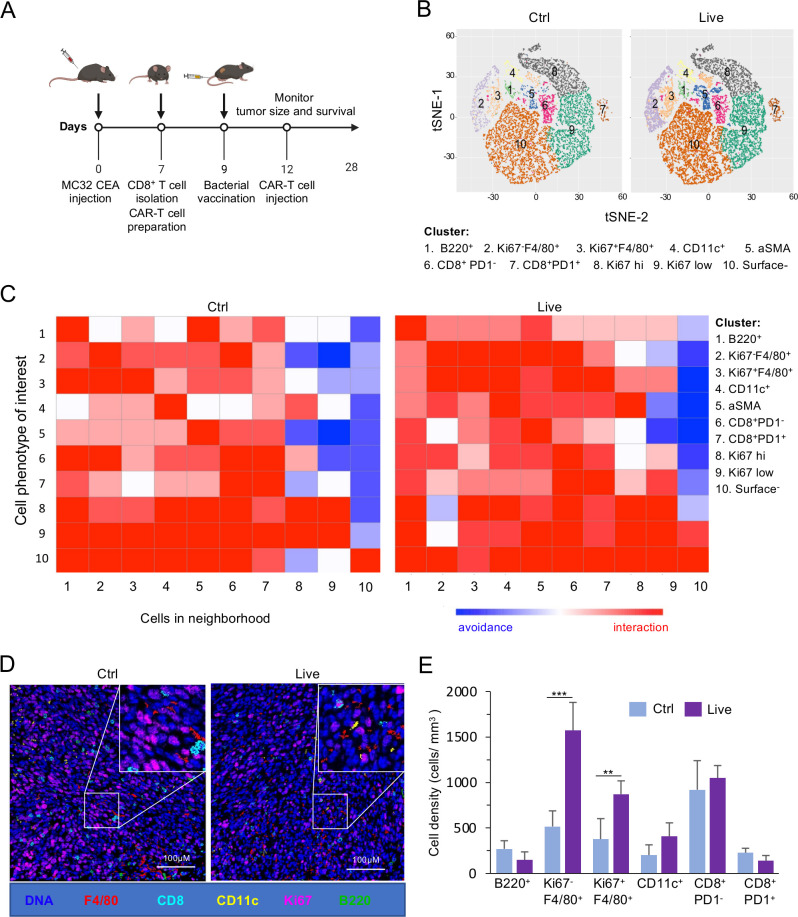
Figure 2.
Live BmΔvjbR-treated mice show a significant increase in innate immune cells. Mass cytometry analysis of MC32 CEA derived tumor samples (three samples/group) from Thy 1.1 mice either intravenously injected with live BmΔvjbR or 1× PBS (Ctrl) prior to intravenous administration of CEA CAR-Ts. (A) Schematic diagram showing adoptive T-cell therapy and BmΔvjbR treatment protocol. (B) Visualization of t-distributed stochastic neighbor embedding (viSNE) plots of comparative immune cell populations in the Ctrl and live BmΔvjbR treated tumor samples. (C) Neighborhood joining plots of different immune cell populations in tumor tissues with highly interacting neighbored cells shown in red, whereas the avoided interactions are shown in blue. (D) Reconstructed image of immune cell infiltration into tumor samples. (E) Quantification of macrophages, dendritic cells, and B cells in tumor samples (three fields/sample were analyzed). **, ***Significance at p< 0.01 and 0.001, respectively. The markers representing the different immune cell populations are B220 (B cells), F4/80 (macrophages), CD11c (dendritic cells), Ki67 (proliferating cells), CD8+ (CD8+ T cells) and surface− (cells are negative to all tested makers). CAR-T, chimeric antigen receptor T cell; CEA, carcinoembryonic antigen; Ctrl, control; PBS, phosphate-buffered saline.

