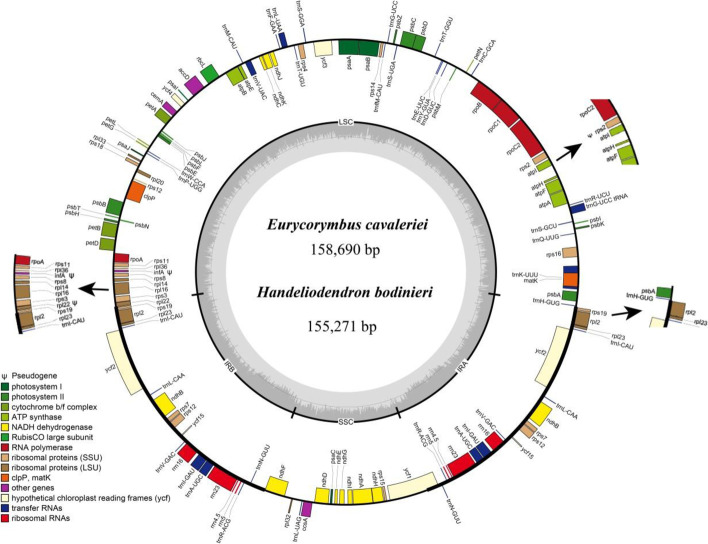
Fig. 1.
Circular gene map of chloroplast genomes of Handeliodendron bodinieri and Eurycorymbus cavaleriei. The gray arrowheads indicate the direction of the genes. Genes on the outside and inside of the circle are transcribed in clockwise and counterclockwise directions, respectively. Genes belonging to different functional groups are color coded. The innermost darker gray corresponds to GC content, whereas the lighter gray corresponds to AT content. IR, LSC, SSC indicate inverted repeat, large single copy region, and small single copy region, respectively. The black arrows indicate annotation in H. bodinieri that are inconsistent with those in E. cavaleriei

