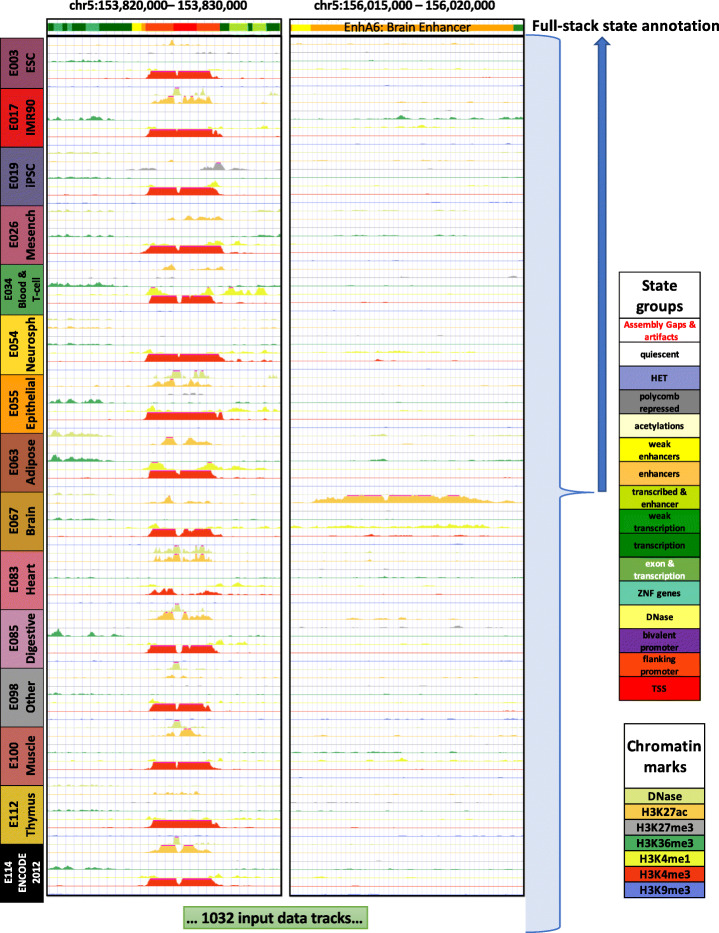
Fig. 1.
Illustration of full-stack modeling annotations. The figure illustrates the full-stack modeling at two loci. The top track shows chromatin state annotations from the full-stack modeling colored based on the legend at right. Below it are signal tracks for a subset of the 1032 input datasets. Data from seven (DNase I hypersensitivity, H3K27me3, H3K36me3, H3K4me1, H3K4me2, H3K4me3, and H3K9me3) of the 32 chromatin marks are shown, colored based on the legend at right. These data are from 15 of the 127 reference epigenomes each representing different cell and tissue groups. The loci on left highlight a genomic region for which a portion is annotated as constitutive promoter states (TSS1-2). The loci on the right panel highlight a region for which a portion is annotated as a brain enhancer state (EnhA6), which has high signals of H3K27ac in reference epigenomes of the group Brain. The concatenated model annotations for these loci from these and additional reference epigenomes can be found in Additional File 1: Fig. S24

