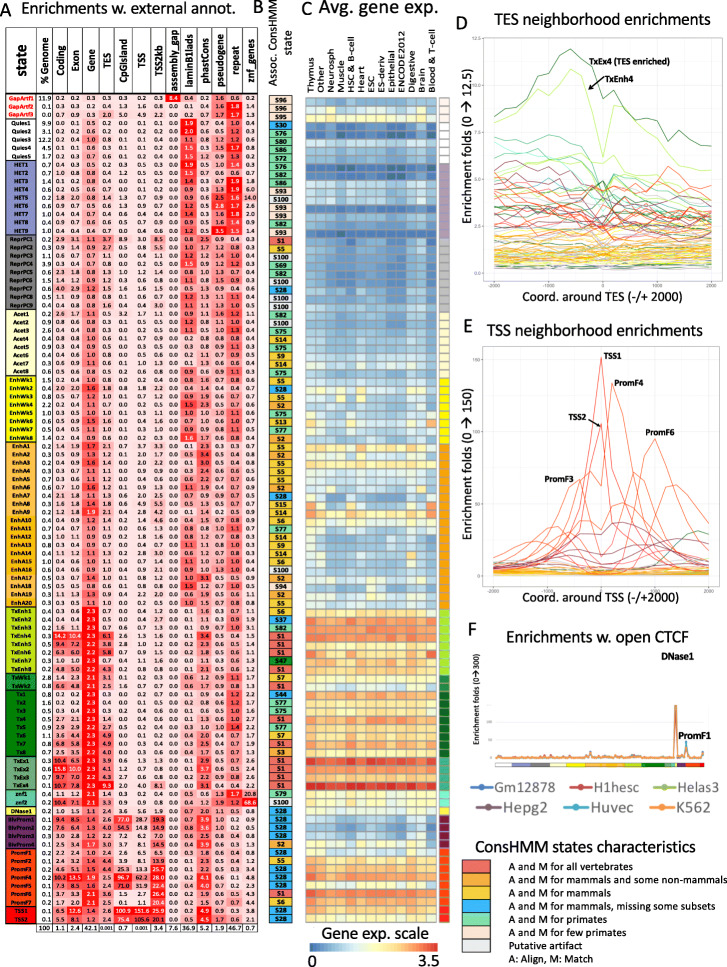
Fig. 3.
Full-stack states enrichments for external genomic annotations. A Fold enrichments of full-stack states with external genome annotations (“Methods”). Each row corresponds to a state and each column corresponds to one external genomic annotation: CpG Islands, Exons, coding sequences, gene bodies (exons and introns), transcription end sites (TES), transcription start sites (TSS), TSS and 2 kb surrounding regions, lamina-associated domains (laminB1lads), assembly gaps, annotated ZNF genes, pseudogenes, repeat elements, and PhastCons constrained element (“Methods”). The last row shows the percentage of the genome that each external genome annotation covers. The heatmap colors are column-normalized, i.e., within each column, the color of the cells are such that highest values are colored red and lowest values are colored white. B Each row indicates the ConsHMM state [30] that has the highest enrichment fold in each full-stack state as ordered in A. Legends of the ConsHMM state groups indicated with different colors are shown below the heatmap in A, and descriptions of select ConsHMM states curated from [30] are available in Additional File 7. C Average weighted expression of genes that overlap each full-stack state in different groups of cells (“Methods”). Each column corresponds to a cell group indicated at the bottom. Each row corresponds to a state, as ordered in A. D,E Positional enrichments of full-stack states relative to annotated D transcription end sites (TES) and E transcription start sites (TSS). Positive coordinate values represent the number of bases downstream in the 5′ to 3′ direction of transcription, while negative values represent the number of bases upstream. Each line shows the positional enrichments in a state. Lines are colored as indicated in A. F Enrichments of full-stacks states with concatenated chromatin states associated with CTCF and open chromatin, but limited histone modifications in six cell types [31] (“Methods”). The six cell types are indicated along the bottom of the figure. States are displayed horizontally in the same order as A. The DNase1 state showed the strongest enrichment for the concatenated chromatin states associated with CTCF and open chromatin in all six cell types

