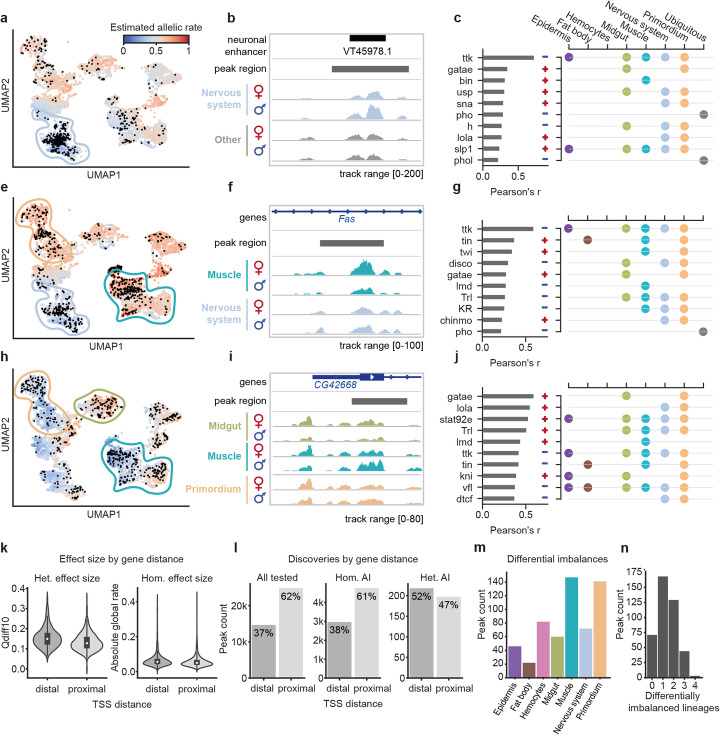
Fig. 3.
Examples and analysis of ATAC peaks with heterogeneous allelic imbalance. a UMAP visualization displaying cells colored by their predicted allelic rate (maternal accessibility relative to total accessibility) for region chr3R:22877489-22878489 in cross F1-DGRP-639. Black dots indicate cells with observed allelic rates (non-zero allelic total counts) that were used to fit the scDALI model. b Genome browser tracks for region chr3R:22877489-22878489 illustrating allele-specific aggregate accessibility for the nervous system and other populations. c Left: Correlation between estimated allelic rates and chromVAR transcription factor (TF) activity scores in individual cells. Shown are the ten strongest associations, with plus and minus signs indicating the direction of correlation. Right: Curated lineage annotation for each TF. e–g Example region chr2R:13675707-13676707 in cross F1-DGRP-639, revealing opposing effects in the nervous system and muscle lineage. h–j Example region chr3R:20310056-20311056 in F1-DGRP-307, revealing lineage-specific differences in allelic rates for the muscle, primordium, and midgut, as well as intra-lineage variation within the muscle population. k Violin plots of effect size estimates for heterogeneously (Qdiff10, i.e., 10% quantile difference as in d) and homogeneously imbalanced (absolute deviation from 0.5) peaks, considering distal and promoter-proximal regions separately. Distal peaks are associated with both larger absolute allelic imbalance and stronger heterogeneity (P = 5.6 × 10⁻⁵, P = 2.17 × 10⁻²⁶, one-sided Mann-Whitney U test). l Total number of peaks tested and peaks with allelic imbalance identified using alternative tests (FDR < 0.1), stratified by the peak distance to the transcription start site (TSS) of the closest gene. Heterogeneously imbalanced peaks are markedly more common at distal regions. m, n By-lineage analysis of allelic imbalance using scDALI-Het for peaks with significant heterogeneous imbalances. m Distribution of the number of differentially imbalanced lineages per peak. n Distribution of the number of peaks with increasing numbers of differentially imbalanced lineages. The majority of peaks show imbalance in a single lineage

