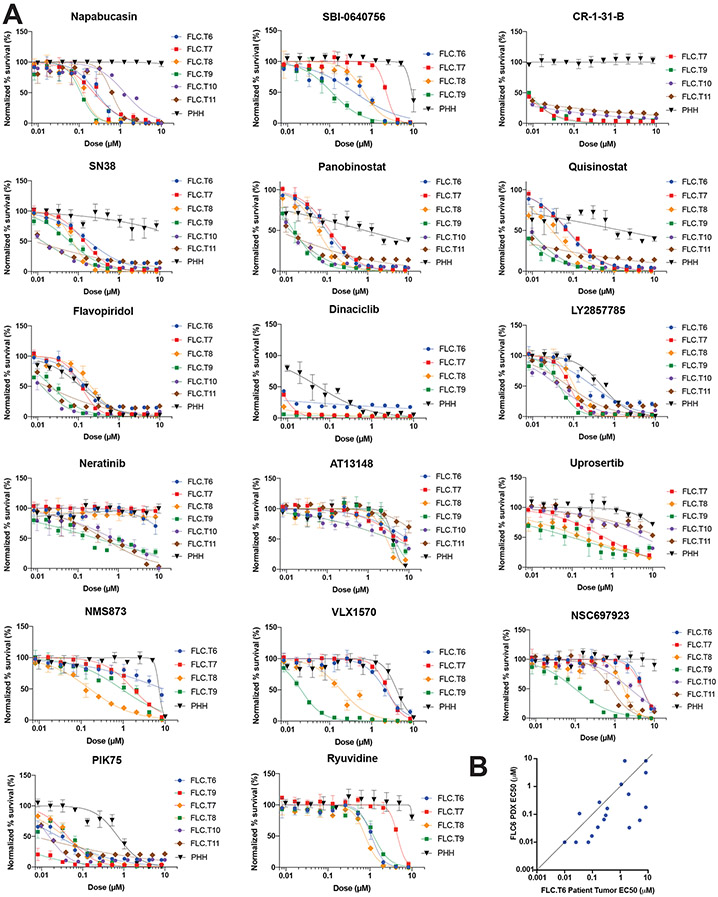
Figure 6: Direct from patient in vitro screening recapitulates findings from PDX screen.
(A) Dose response curve of drugs tested in triplicate against cells dissociated directly from patient tumors (T6-T11) versus PHH. Error bars – standard deviation. Drugs were tested at 10μM-10nM with 2-fold serial dilution. The y-axis shows normalized percent survival calculated as 100 –[(positive control–drug response)/(positive control-negative control)*100]. Cells were treated for 72h, and normalized percent survival was quantified using Cell Titer Glo. (B) Comparison of the EC50 in cells dissociated from patient tumor FLC.T6 vs cells dissociated from its derived PDX FLC6.

