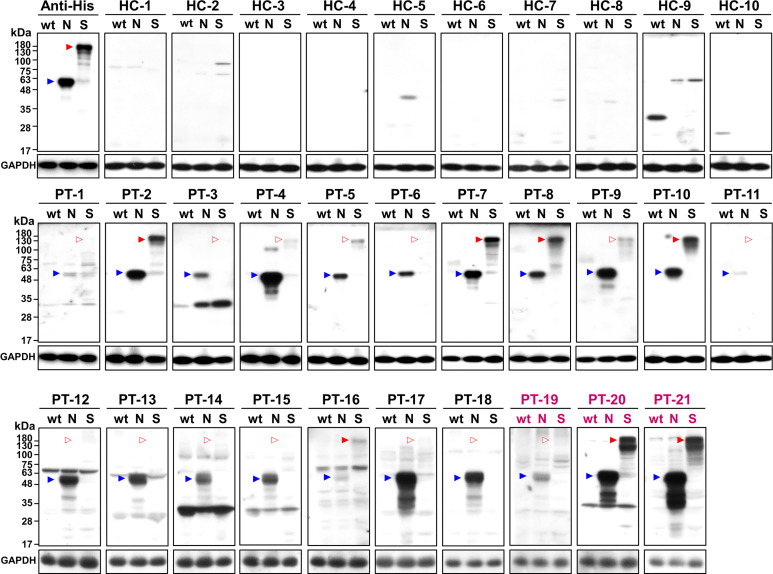
Figure 3.
Western blot analysis of healthy controls (HC) and patients (PT) using wt-cells (wt), N-cells (N), or S-cells (S). Arrowheads indicate the position of N (blue) and S (red) proteins. Empty arrowheads indicate positions with weak or lacking apparent signal. Patient sera marked in magenta are samples of the Alpha variant.

