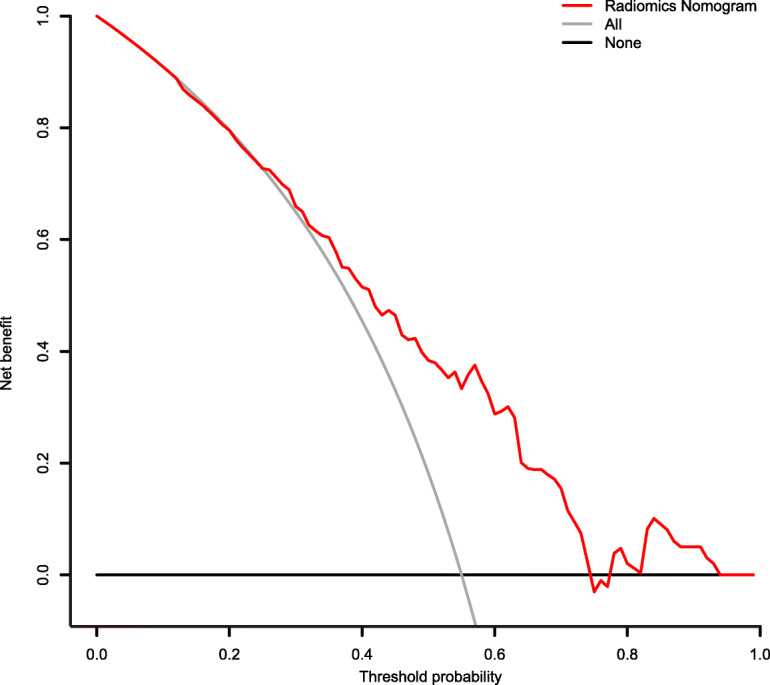
Fig. 4.

DCA for the rad-score. DCA for the radiomics nomogram. The y-axis represents the net benefit. The red line represents the radiomics nomogram. The gray line represents the hypothesis that all patients had LN metastases. The black line represents the hypothesis that no patients had LN metastases. The x-axis represents the threshold probability, which is where the expected benefit of treatment is equal to the expected benefit of avoiding treatment. The decision curves in the validation set showed that if the threshold probability is between 0.25 and 0.75, the radiomics nomogram developed in the current study to predict LN metastases adds more benefit than the treat-all or treat-none scheme
