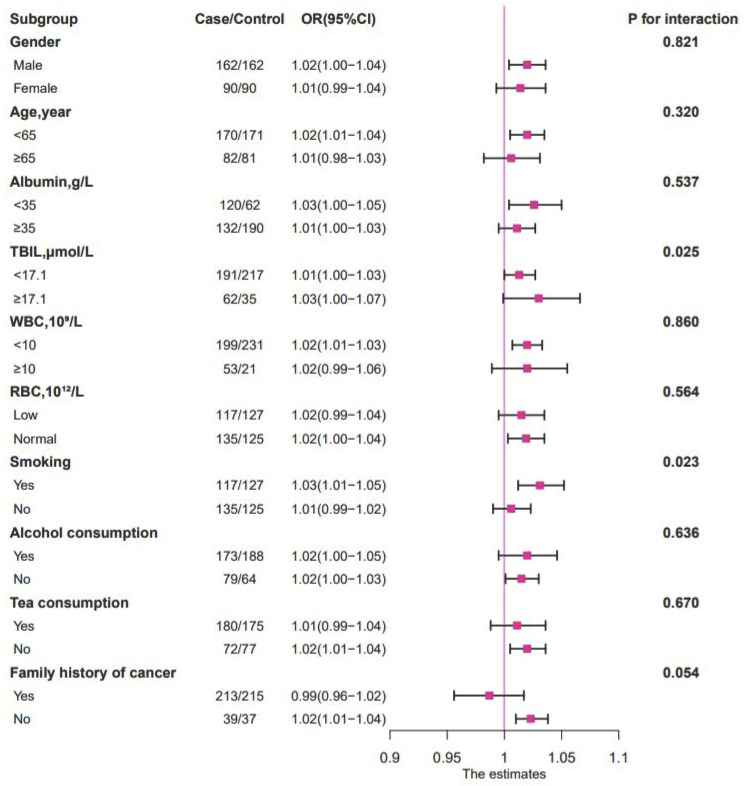
Figure 3.
The relationship between PLT (as continue value) and the 1-year OS of patients with cancer cachexia in different subgroups. Notes: The conditional logistic regression model was used to calculate the relationship between ORs and PLT (as continue value) of patients with cancer cachexia at 1 year. Each subgroup was adjusted for BMI, HGS, MAC, albumin, TBIL, WBC, RBC, TSF, chemotherapy, radiotherapy, surgery. OR: odds ratio; P: probability; TBIL: total bilirubin; WBC: white blood cell; RBC: red blood cell.

