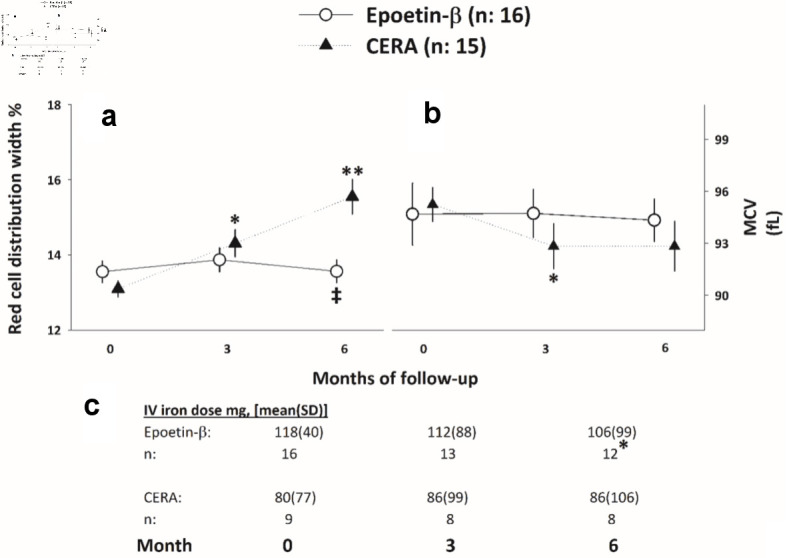
Figure 4.

(a, b) RDW and MCV evolution throughout the study. *, **P < 0.05 respect to baseline. ‡P < 0.05 respect to the CERA arm. (c) Iron requirements evolution throughout the study. *P < 0.05, Cochran test. CERA: continuous erythropoietin receptor activator; RDW: red cell distribution width; MCV: mean corpuscular volume; SD: standard deviation.
