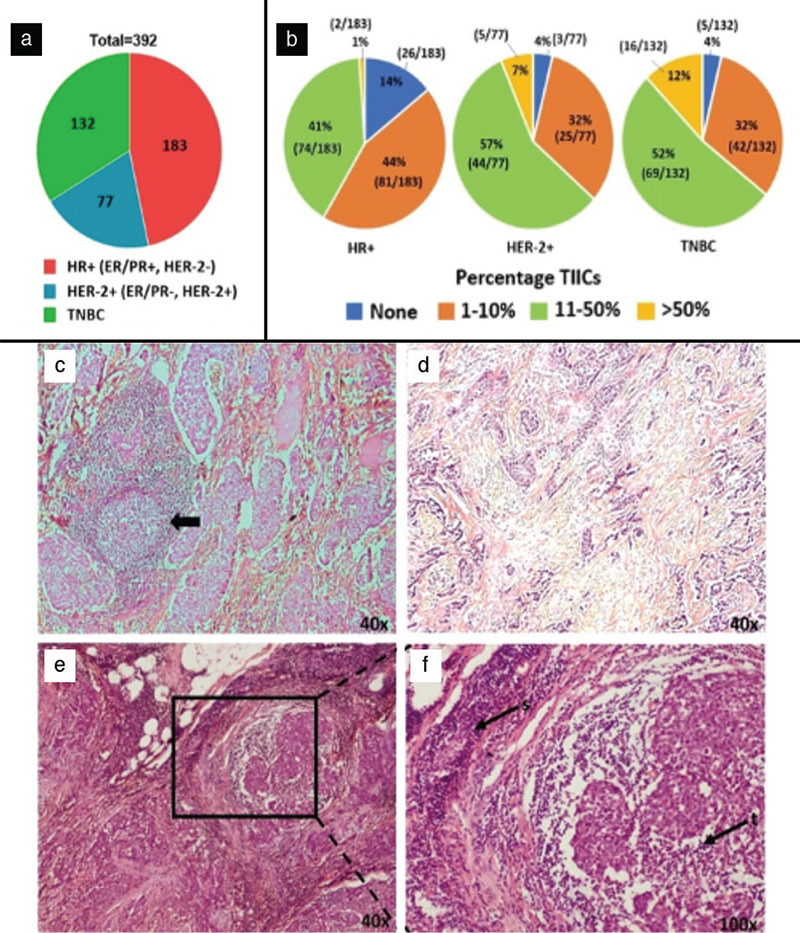
Figure 1.

a) Pie chart showing the number of retrospective cases (n = 392) among various subtypes of breast cancer. b) Pie charts showing tumor infiltrating immune cells (TIICs) across various breast cancer subtypes. The number of immune cells per field in tumor sections was divided into four categories: 0% cells, 1%–10% cells (mild), 11%–50% cells (moderate), >50% cells (dense). c) TIICs as lymphoid follicles (arrow) with germinal centers. Representative images for d) mild TIICs (1%–10%), e) dense TIICs (>50%). f) Magnified image of e. Immune cells infiltrating tumor (t) and stroma (s)
