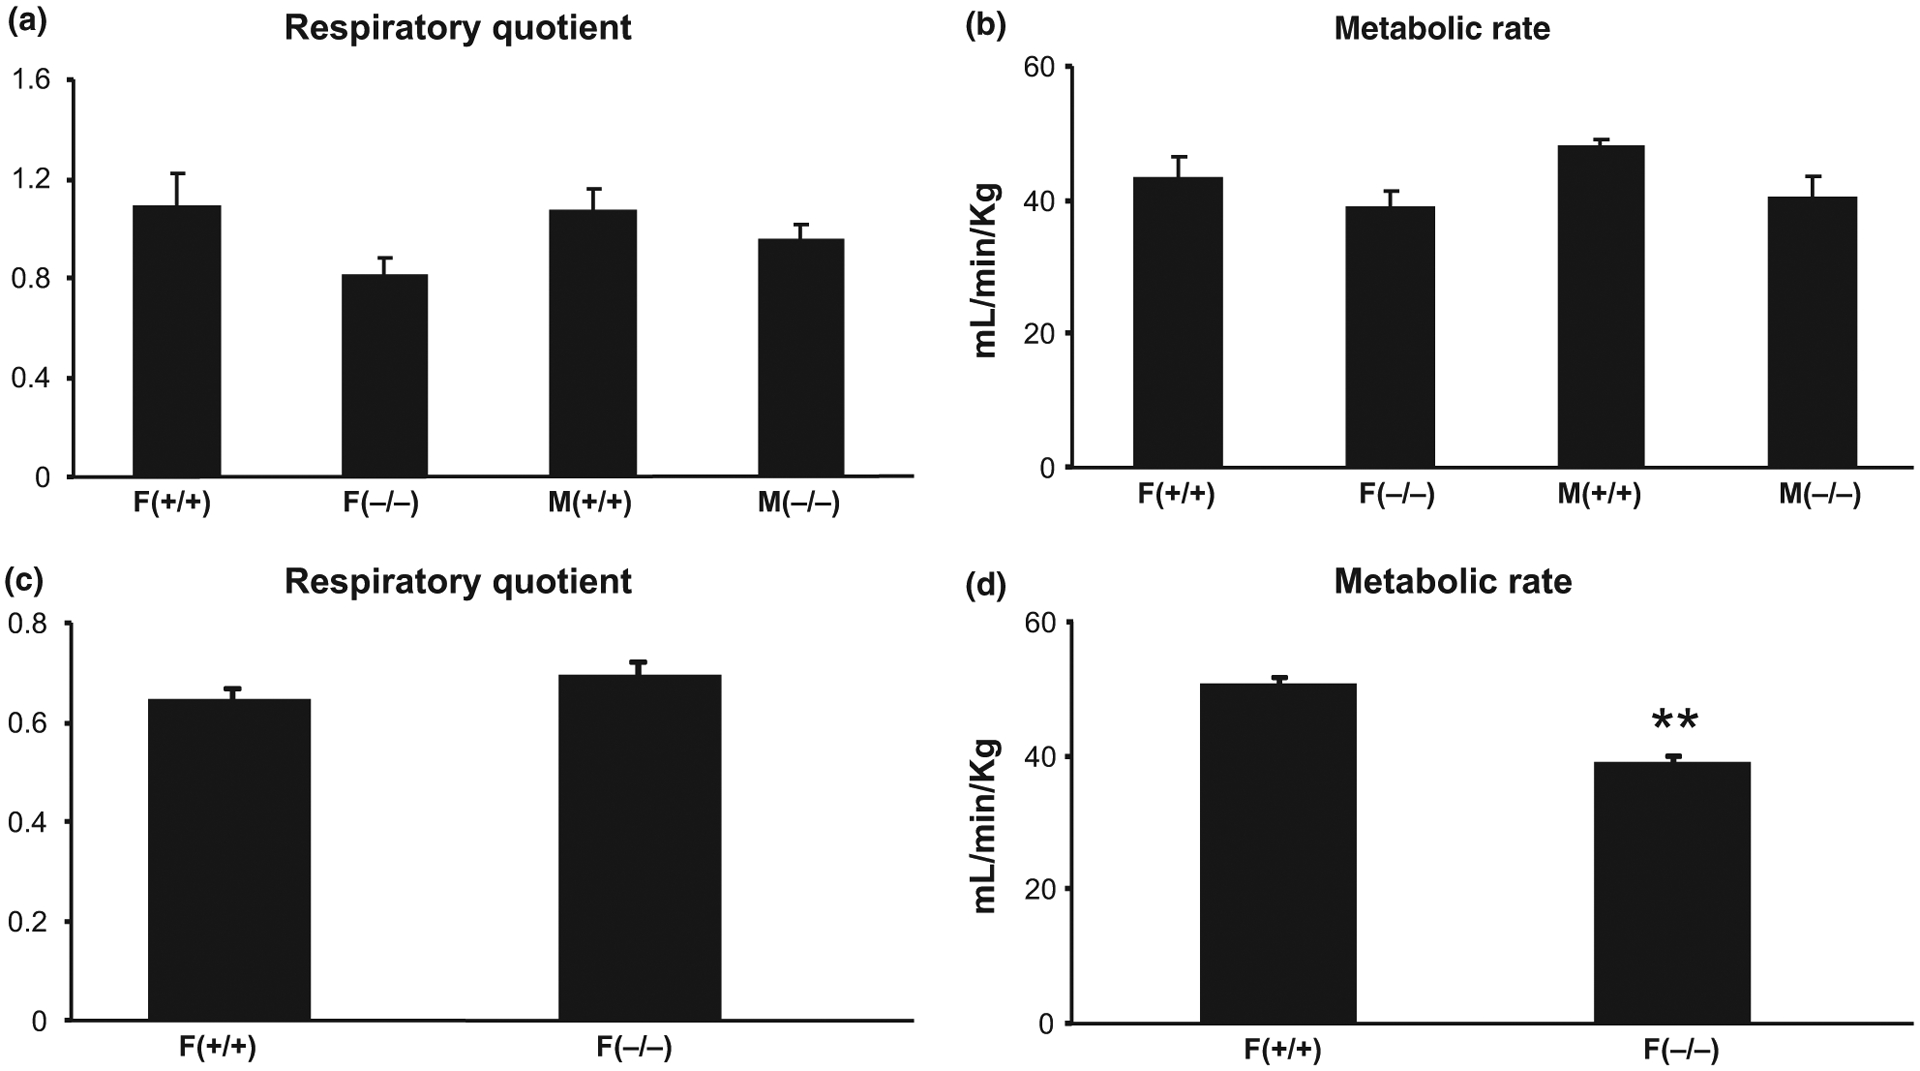
Fig. 3.

Differences in metabolic markers [respiratory quotient and metabolic rate (MR)] between old (18–20 months) male and female (a and b) and adult (7–9 months) female (c and d) Hcrt KO and WT mice. Each bar represents the mean value + SEM. **Significant difference between Hcrt KO and WT mice at the levels of p < 0.01.
