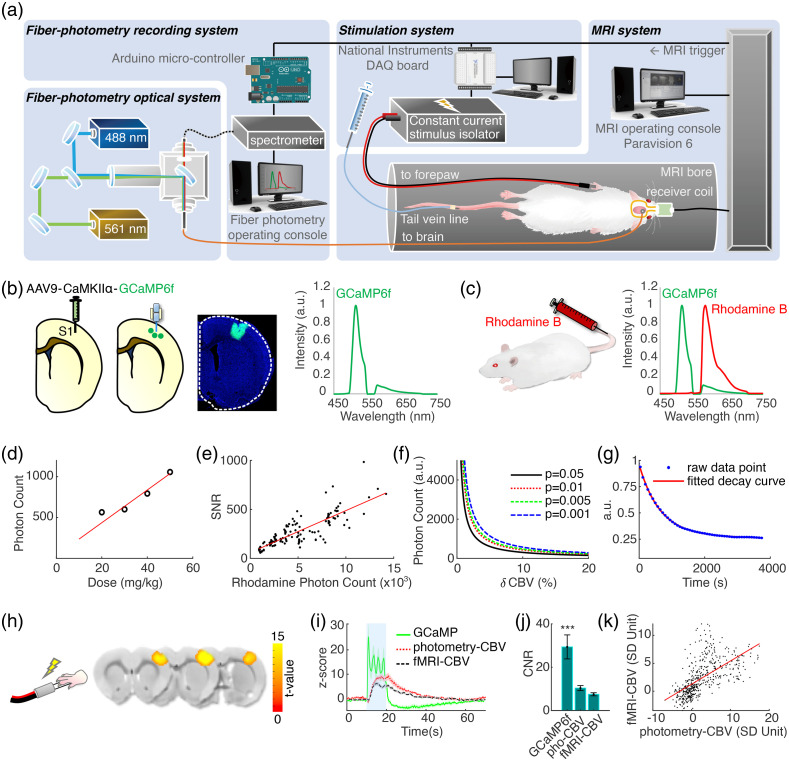
Fig. 1.
(a) The setup of the spectral fiber-photometry platform synchronized with a 9.4T small animal MRI system. 488- and 561-nm laser light is combined and delivered to the rat brain through a fiber optic cable connected to an implanted optical fiber. Fluorescence emission signal returns through the same cable, then is delivered to a spectrometer for recording, which is synchronized in time to 1 Hz fMRI acquisition by TTL pulses, upsampled to 10 Hz through an Arduino board. The stimulation system for electrical forepaw stimulation is also synchronized to fMRI acquisition and is controlled by a separate PC with a DAQ board. (b) GCaMP6f is expressed via microinjection of genetically engineered AAV into the target brain area. An optical fiber is implanted 0.3 mm above the injection site. The GCaMP6f emission wavelength has a peak at 515 nm. (c) To monitor CBV activity with photometry, Rhodamine B is injected via tail vein catheter. GCaMP6f and Rhodamine B spectra are unmixed to derive their coefficients for quantification. (d) Multi-dose test revealed that Rhodamine B spectral peak photon counts are linearly correlated with Rhodamine B injection dose (mg/kg). (e) The SNR and spectral peak photon counts of Rhodamine B recordings are linearly correlated. (f) Rhodamine B photon counts needed for detecting CBV changes of various magnitudes at different statistical thresholds. (g) The half-life of Rhodamine B clearance following bolus injection is measured at 698.3 s. (h) fMRI-CBV response maps to the electrical forepaw stimulation paradigm consisting of a 60 s initial baseline period followed by two sets of 10 s electrical forepaw stimulation blocks (9 Hz, 2.5 mA, 0.5 ms) with 60 s resting periods after each block. (i) Time-courses of GCaMP6f (green), photometry-CBV (red) and fMRI-CBV (black) from S1, aligned to electrical forepaw stimulation. (j) Photometry-CBV has higher CNR than fMRI-CBV (), and GCaMP shows the highest CNR. The CNR is calculated by dividing the evoked response peak value with the standard deviation of baseline fluctuation (GCaMP: , Rhodamine-CBV: , fMRI-CBV: ). (k) Photometry-CBV and fMRI-CBV peak response amplitudes to electrical forepaw stimulation are linearly correlated. Demo of simultaneous multimodal fiber-photometry and fMRI recordings in S1 (Video 1, MOV, 8 MB [URL: https://doi.org/10.1117/1.NPh.9.3.032205.1]).

