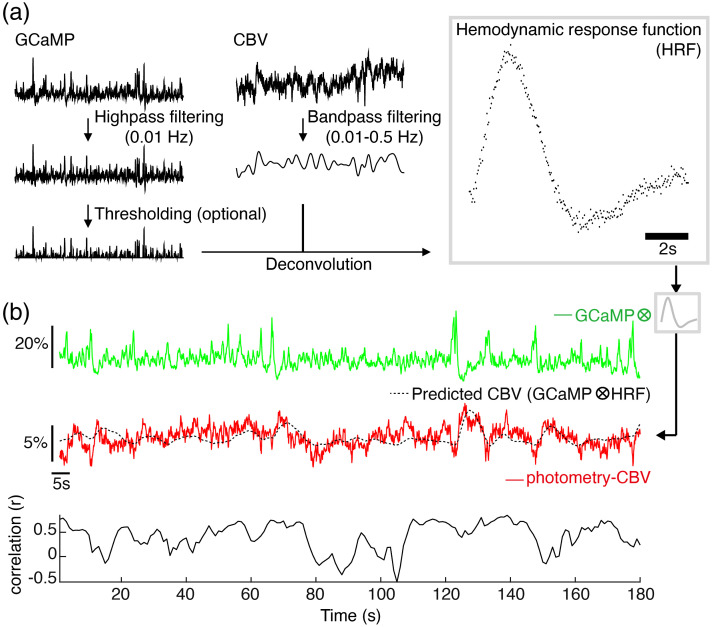
Fig. 2.
A HRF derived from GCaMP6f and Rhodamine B signals in rat S1 has good predictability for S1 photometry-CBV changes. (a) The pipeline to calculate HRFs from simultaneously recorded GCaMP6f (green) and photometry-CBV (red) time-course. (b) An example of predicted-CBV activity (black) calculated by convolving the derived HRF [shown in (a)] with an independent GCaMP6f time-course (green), the predicted-CBV activity shows a high degree of correlation over time (correlation sliding window width = 5 s) with the corresponding, independently measured, photometry-CBV activity (red). Note that sometimes we observed flipping correlations between positive and negative. Specifically, this instability happened when there was relatively weak neuronal activity within the sliding window, where the CBV changes could be so subtle and buried under random noises. Therefore, the sliding window correlations during weak neuronal activity could be randomly positive or negative.

