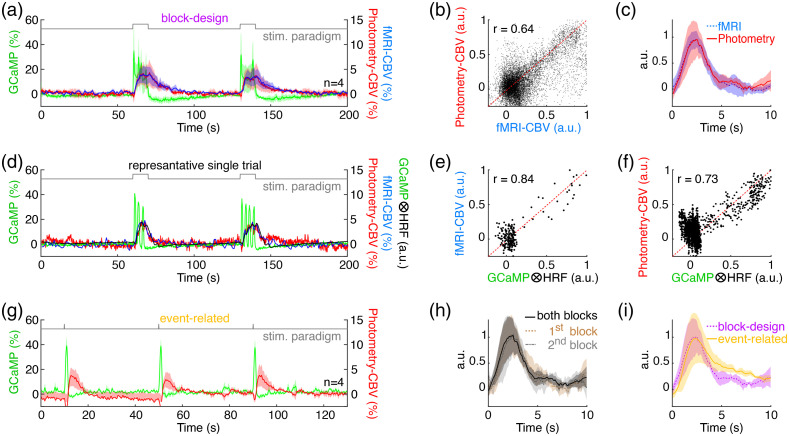
Fig. 4.
Cross-validation of HRFs derived from photometry-CBV and fMRI-CBV signal changes, or using different stimulation paradigms (). (a) Simultaneously measured fMRI-CBV (blue), photometry-CBV (red) and GCaMP6f (green) time-courses from rat S1, aligned to block-design electrical forepaw stimulation paradigm (gray). (b) Photometry-CBV and fMRI-CBV signals from S1 during blocks of electrical forepaw stimulation are highly correlated (CBV time-courses from the four rats, two repetitions, are all normalized to individual maximum then pooled together). (c) Excellent agreement () was identified between the HRFs derived using fMRI-CBV (blue) and photometry-CBV (red). (d) Representative simultaneously measured fMRI-CBV (blue), photometry-CBV (red), and GCaMP6f (green) time-courses from rat S1, aligned to blocks of electrical forepaw stimulation. It should be noted that GCaMP signal drop below baseline after stimulation, likely due to hemoglobin absorption.27,28,43 The predicted-CBV time-course (black) calculated by convolving the GCaMP6f time-course with the photometry-CBV HRF (c), red is also shown. (e) The predicted-CBV via GCaMP6f time-course and the photometry-CBV HRF has a high correlation with the corresponding photometry-CBV time-course from the same independent dataset. (f) The predicted-CBV time-course calculated by convolving the GCaMP6f time-course with the fMRI-CBV HRF (c), blue also has a high correlation with the corresponding fMRI-CBV time-course from the same independent dataset. The CBV fluctuation around zero, might be due to spontaneous hemodynamic fluctuations by non-neural processes as described in the previous study.60 (g) Simultaneously measured fMRI-CBV (blue), photometry-CBV (red) and GCaMP6f (green) time-courses from rat S1, aligned to event-related forepaw stimulation paradigm (gray). (h) Excellent agreement () was identified between the HRFs derived using the photometry signals recorded during both blocks (0 to 200 s), first block (31-100 s), and second block (101-170 s) in (a). (i) Good agreement () was identified between the HRFs derived using the photometry signals of block-design (a) and event-related (g) stimulation paradigm. In all figures, the shaded area represents standard error. ICC agreement guideline given by Koo and Li (2016):61 below 0.50 = poor, between 0.50 and 0.75 = moderate, between 0.75 and 0.90 = good, above 0.90 = excellent.

