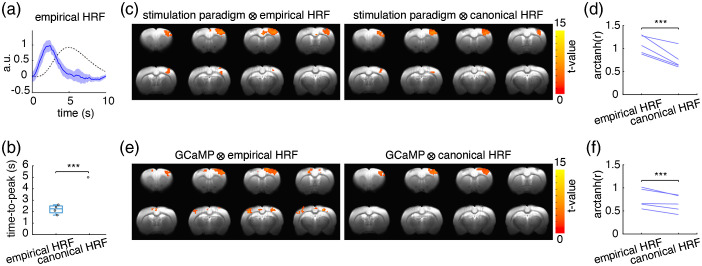
Fig. 5.
Using the fiber-photometry derived empirical HRF for fMRI analyses improved detection of S1 activation clusters and downstream activity compared to analyses using the canonical HRF. (a) The rat S1 empirical HRF (blue, the shaded area represents standard error) derived using S1 GCaMP and photometry-CBV signals was substantially narrower than the human-based canonical HRF (black dashed line), which is implemented in the SPM package for brain data analysis by default.11 (b) The time-to-peak of the empirical HRF was significantly shorter than the canonical HRF (). (c) The detected S1 activation cluster size was larger when the stimulation paradigm was convolved with the empirical HRF than with the canonical HRF for GLM analysis of the fMRI data (). (d) The correlation between the regressor-generated CBV time-course and the fMRI-CBV time-course measured from the corresponding S1 activation cluster was significantly higher when using the empirical HRF versus the canonical HRF for regressor calculation. The correlations were Fisher transformed to meet the requirement as normal distribution for Student T-test and shown in arctanh(r), . (e) A significant activation cluster was detected in bilateral PPC by convolving the GCaMP6f signal with the empirical HRF but not the canonical HRF (). (f) The correlation between the regressor-generated CBV time-course and the fMRI-CBV time-course measured from the corresponding S1 activation cluster was significantly higher when using the empirical HRF and GCaMP6f signal versus the canonical HRF and GCaMP6f for regressor calculation The correlations were Fisher transformed to meet the requirement as normal distribution for Student T-test and shown in arctanh(r), .

