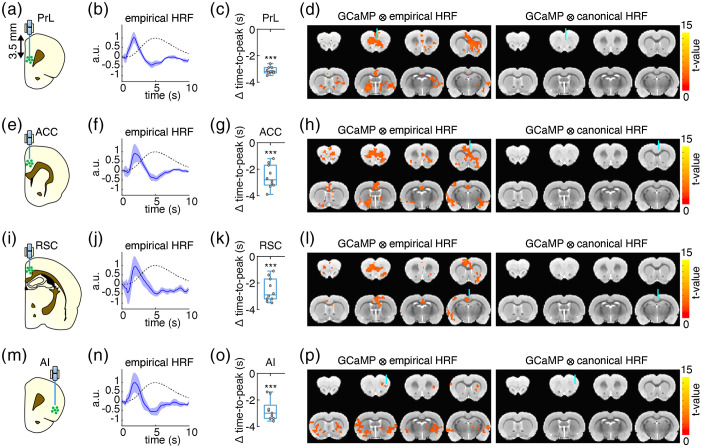
Fig. 6.
(a, e, i, and m) Fiber-photometry recording sites in rat cortical areas used for calculating empirical HRFs. Each rat was implanted fibers in PrL, ACC, RSC, and AI (, each rat was recorded two repetitions of 10 min resting-state). (b, f, j, n) The empirical HRFs derived resting-state GCaMP6f and Rhodamine B time-course data recorded by fiber-photometry (blue solid line, the shaded area represents standard error) versus the canonical HRF (black dashed line). (c, g, k, o) The time-to-peak differences of the empirical HRFs versus canonical HRF ( time-to-peak); negative values indicate time-to-peak latencies shorter than the canonical HRF (all ). (d, h, l, p) GLM analyses of fMRI data using spontaneous GCaMP6f signals convolved with the empirical HRFs as regressors detected brain-wide functional networks (left panels), which could not be detected using the same GCaMP6f signals convolved with the canonical HRF as regressors (right panels) (, ). Note that the GLM coefficients below each optic fiber targeting site were not the strongest among the whole functional networks (left panels). It is likely due to confounds associated with fiber implantation and/or susceptibility effect cause by fiber, which is commonly observed in fMRI studies with optic fiber implant.44–46

