Figure 2:

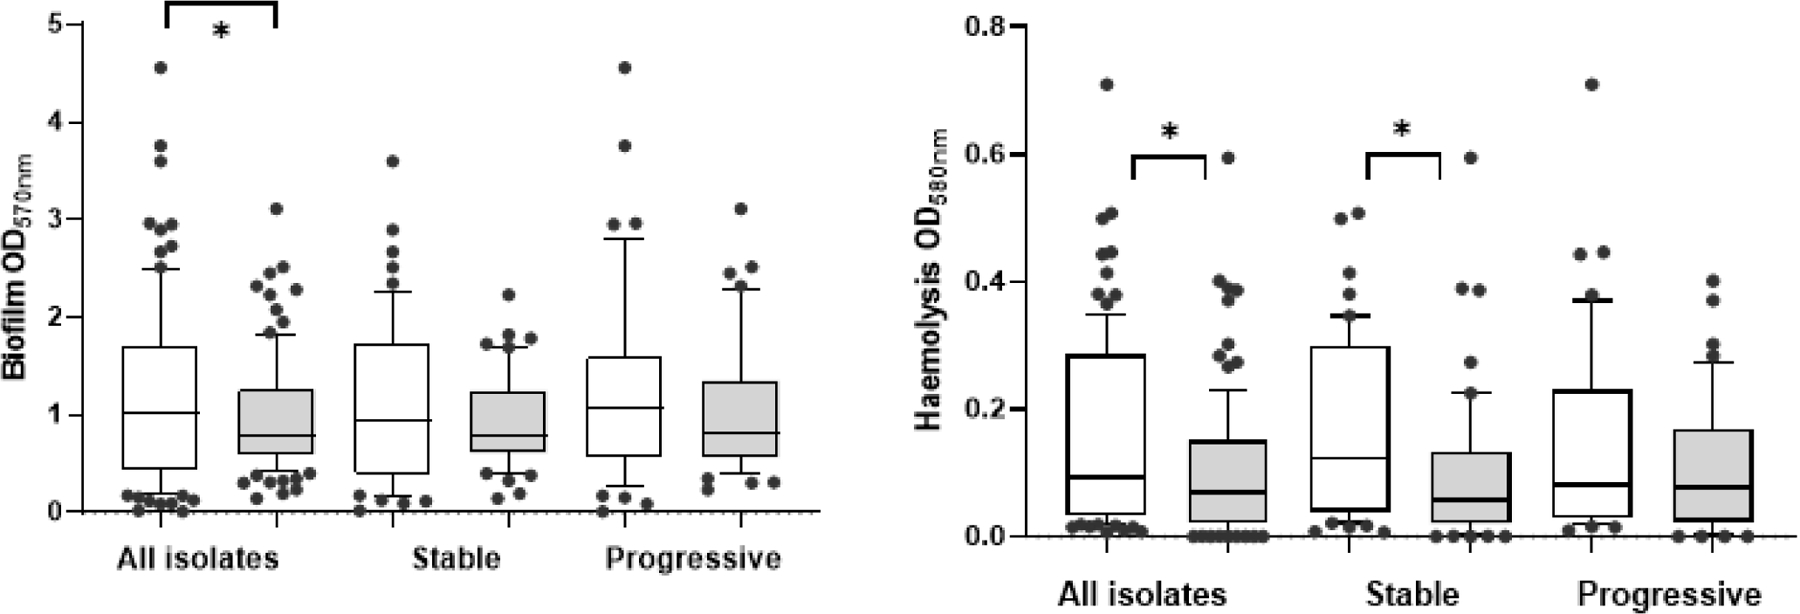
Biofilm (A) and Haemolysis (B) aerobic and anaerobic growth conditions. Comparisons by Wilcoxon test. Bars indicate mean ± SEM. Open bar indicates aerobic and shaded bar anaerobic conditions with scatter 10–90%.

Biofilm (A) and Haemolysis (B) aerobic and anaerobic growth conditions. Comparisons by Wilcoxon test. Bars indicate mean ± SEM. Open bar indicates aerobic and shaded bar anaerobic conditions with scatter 10–90%.