. 2021 Dec 6;14(2):263–276. doi: 10.1039/d1nr06512b

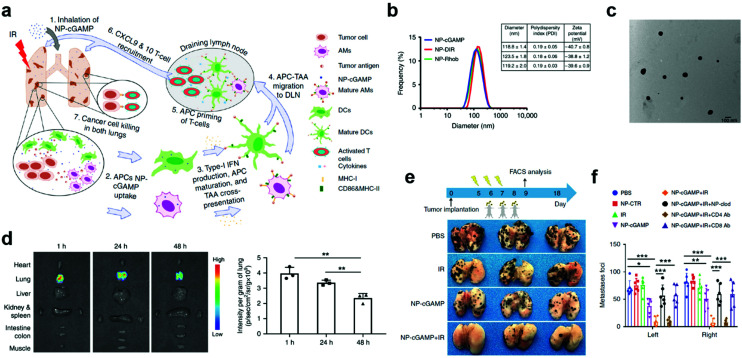
Fig. 5. APC-targeting and immunostimulator co-delivery strategies to improve protective immunity at mucosal sites. (a) Schematic illustration of the inhalable phosphatidylserine-coated and STING agonist cyclic guanosine monophosphate-adenosine monophosphate (cGAMP)-loaded liposomes (NP-cGAMP) for enhancing antitumor immunity against lung metastases. APC, antigen presenting cell. DLN, draining lymph node. IR, irradiation. TA, tumor antigen. (b) Size distribution, polydispersity index, and surface charge of NP-cGAMP, NP labeled with DIR (NP-DIR), and NP labeled with Rhob (NP-Rhob) by dynamic light scattering (DLS). (c) TEM images of NP-cGAMP. (d) Representative ex vivo fluorescence imaging of major organs dissected from 4T1-luc lung metastases-bearing mice at 1, 24, and 48 h post inhalation of DiR-labeled PS-coated NPs. Light signals were exclusively from both lungs and the lung signals were quantified (n = 3 biologically independent mice/time; **P < 0.01, Student's t test). (e) NP-cGAMP inhalation synergized with radiotherapy by eliciting APC-mediated adaptive immunity in B16F10-OVA melanoma lung metastasis model. On day 5, after confirming development of multifocal metastases in both lungs, the mice were treated with fractionated radiation to the right lung (IR, 8 Gy × 3), inhalation of NP-cGAMP (24 h after each IR for three doses), or a combination of them. NP-CTR (2′5′-GpAp) served as a control of NP-cGAMP. To deplete pulmonary APCs, NP-clodronate was administered via inhalation 6 h before each of the three NP-cGAMP inhalations. To deplete CD4+ or CD8+ T cells, anti-CD4 Ab or anti-CD8α Ab was injected intraperitoneal (i.p.) (400 μg), respectively, one day before IR and repeated 7 days later. The mice (n = 6) were sacrificed on day 18 and representative lungs from the treatment groups were displayed. (f) Lungs after treatments in (e) were examined under a dissecting microscope and a total of metastatic lung foci on each lung were counted. Data are shown as mean ± SD of n = 6 biologically independent samples. *P < 0.05, **P < 0.01, and ***P < 0.001 by Student's t test. Reproduced with permission.63 Copyright 2019, Nature Publishing Group.

Fig. 5