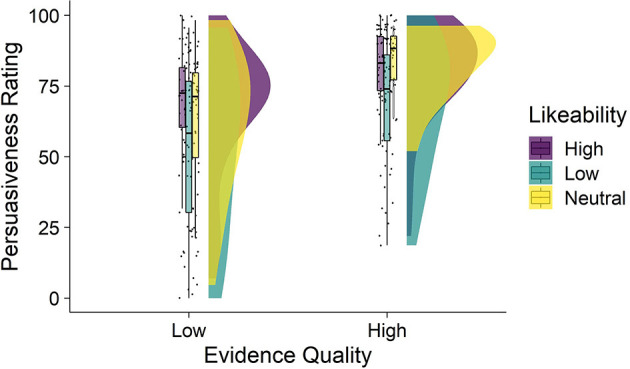
Figure 2.

Persuasiveness as a function of expert evidence quality and likeability (Study 2). Figure depicts four raincloud plots showing the distribution of persuasiveness ratings observed in each condition. From left to right, each raincloud plot depicts the: jittered individual data points, box-and-whisker plots (middle bar within the box is the median, the box represents the interquartile range of persuasiveness ratings, and the whiskers represent persuasiveness ratings no further than 1.5 × the interquartile range), and the distributions showing the frequency of persuasiveness ratings. Mean persuasiveness ratings differed by evidence quality and likeability conditions.
