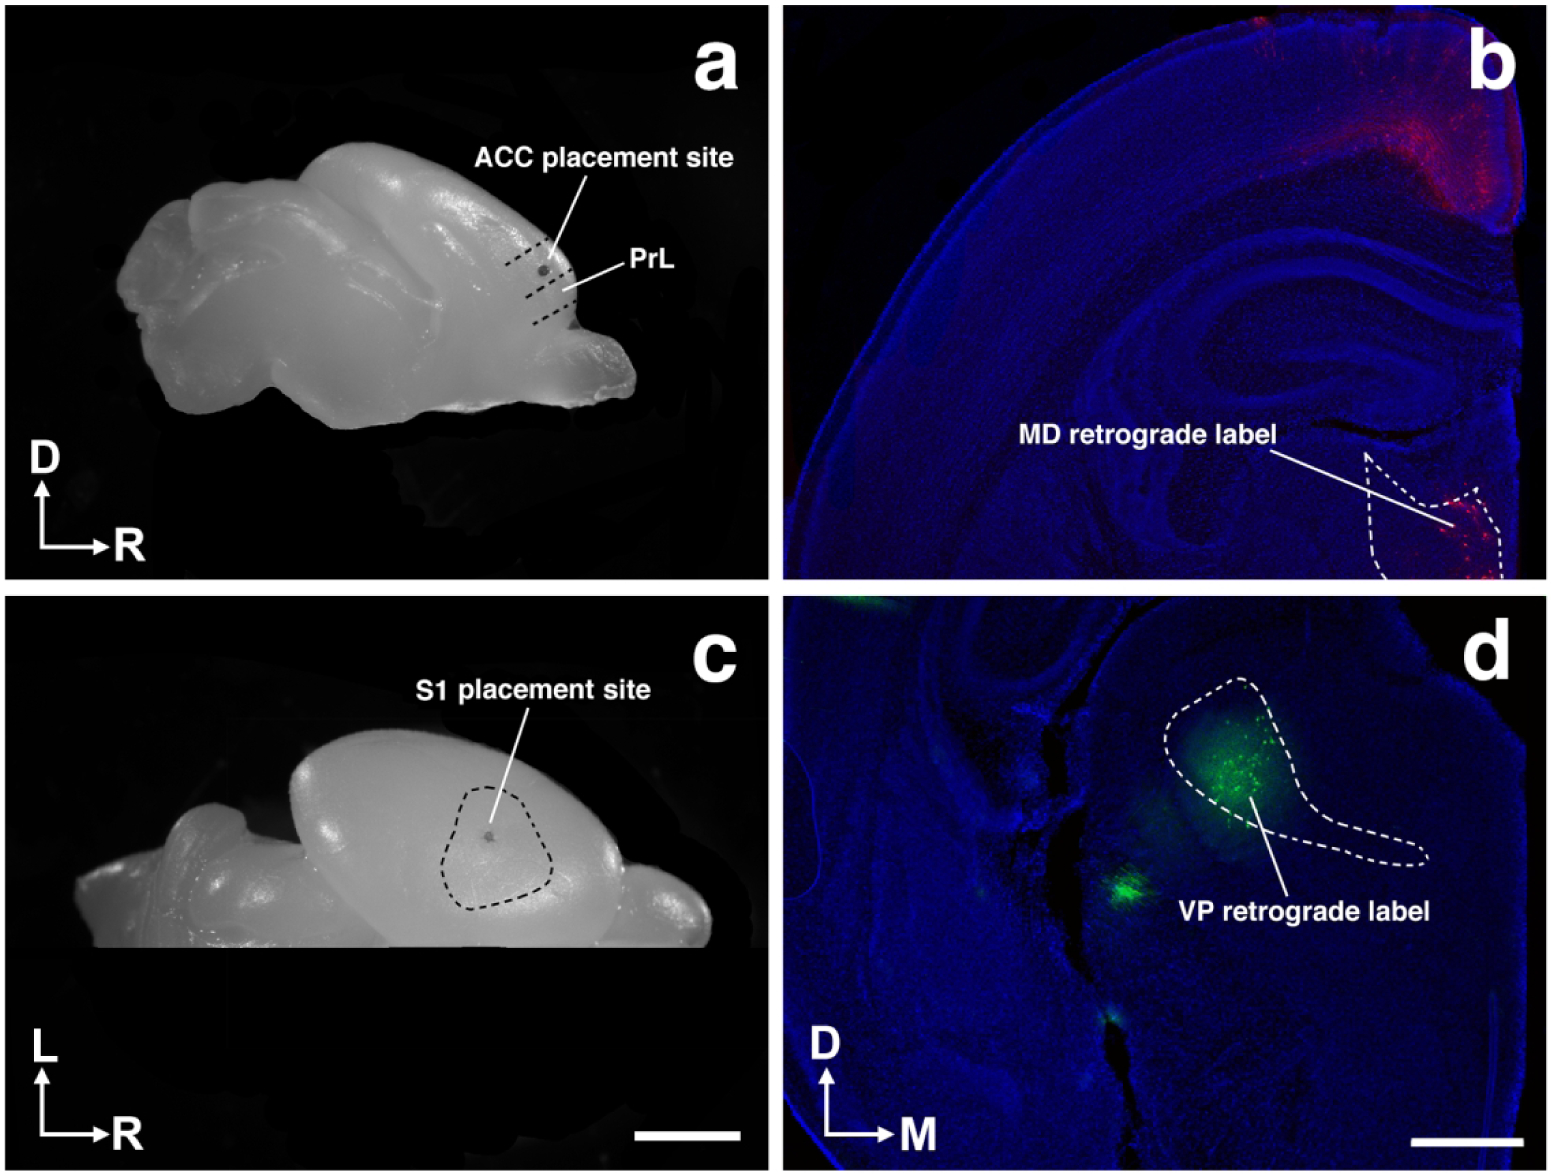
Figure 2. Dye placement and thalamic verification.

Representative whole hemisphere views of brains with dye placements in putative ACC (a) and S1 (c). b, Coronal section of P1 vole hemisphere demonstrating retrograde labeling in the mediodorsal nucleus of the thalamus (MD) stemming from ACC dye placement as seen in a. d, Coronal section of P1 vole hemisphere demonstrating retrograde labeling in the ventral posterior nucleus of the thalamus (VP) stemming from S1 dye placement as seen in (c). Image oriented dorsal (D) up, rostral (R) right in (a); lateral (L) up, rostral (R) right in (c); dorsal (D) up, medial (M) right in (b,d). Scale bars = 2 mm (a,c) and 500 μm (b,d).
