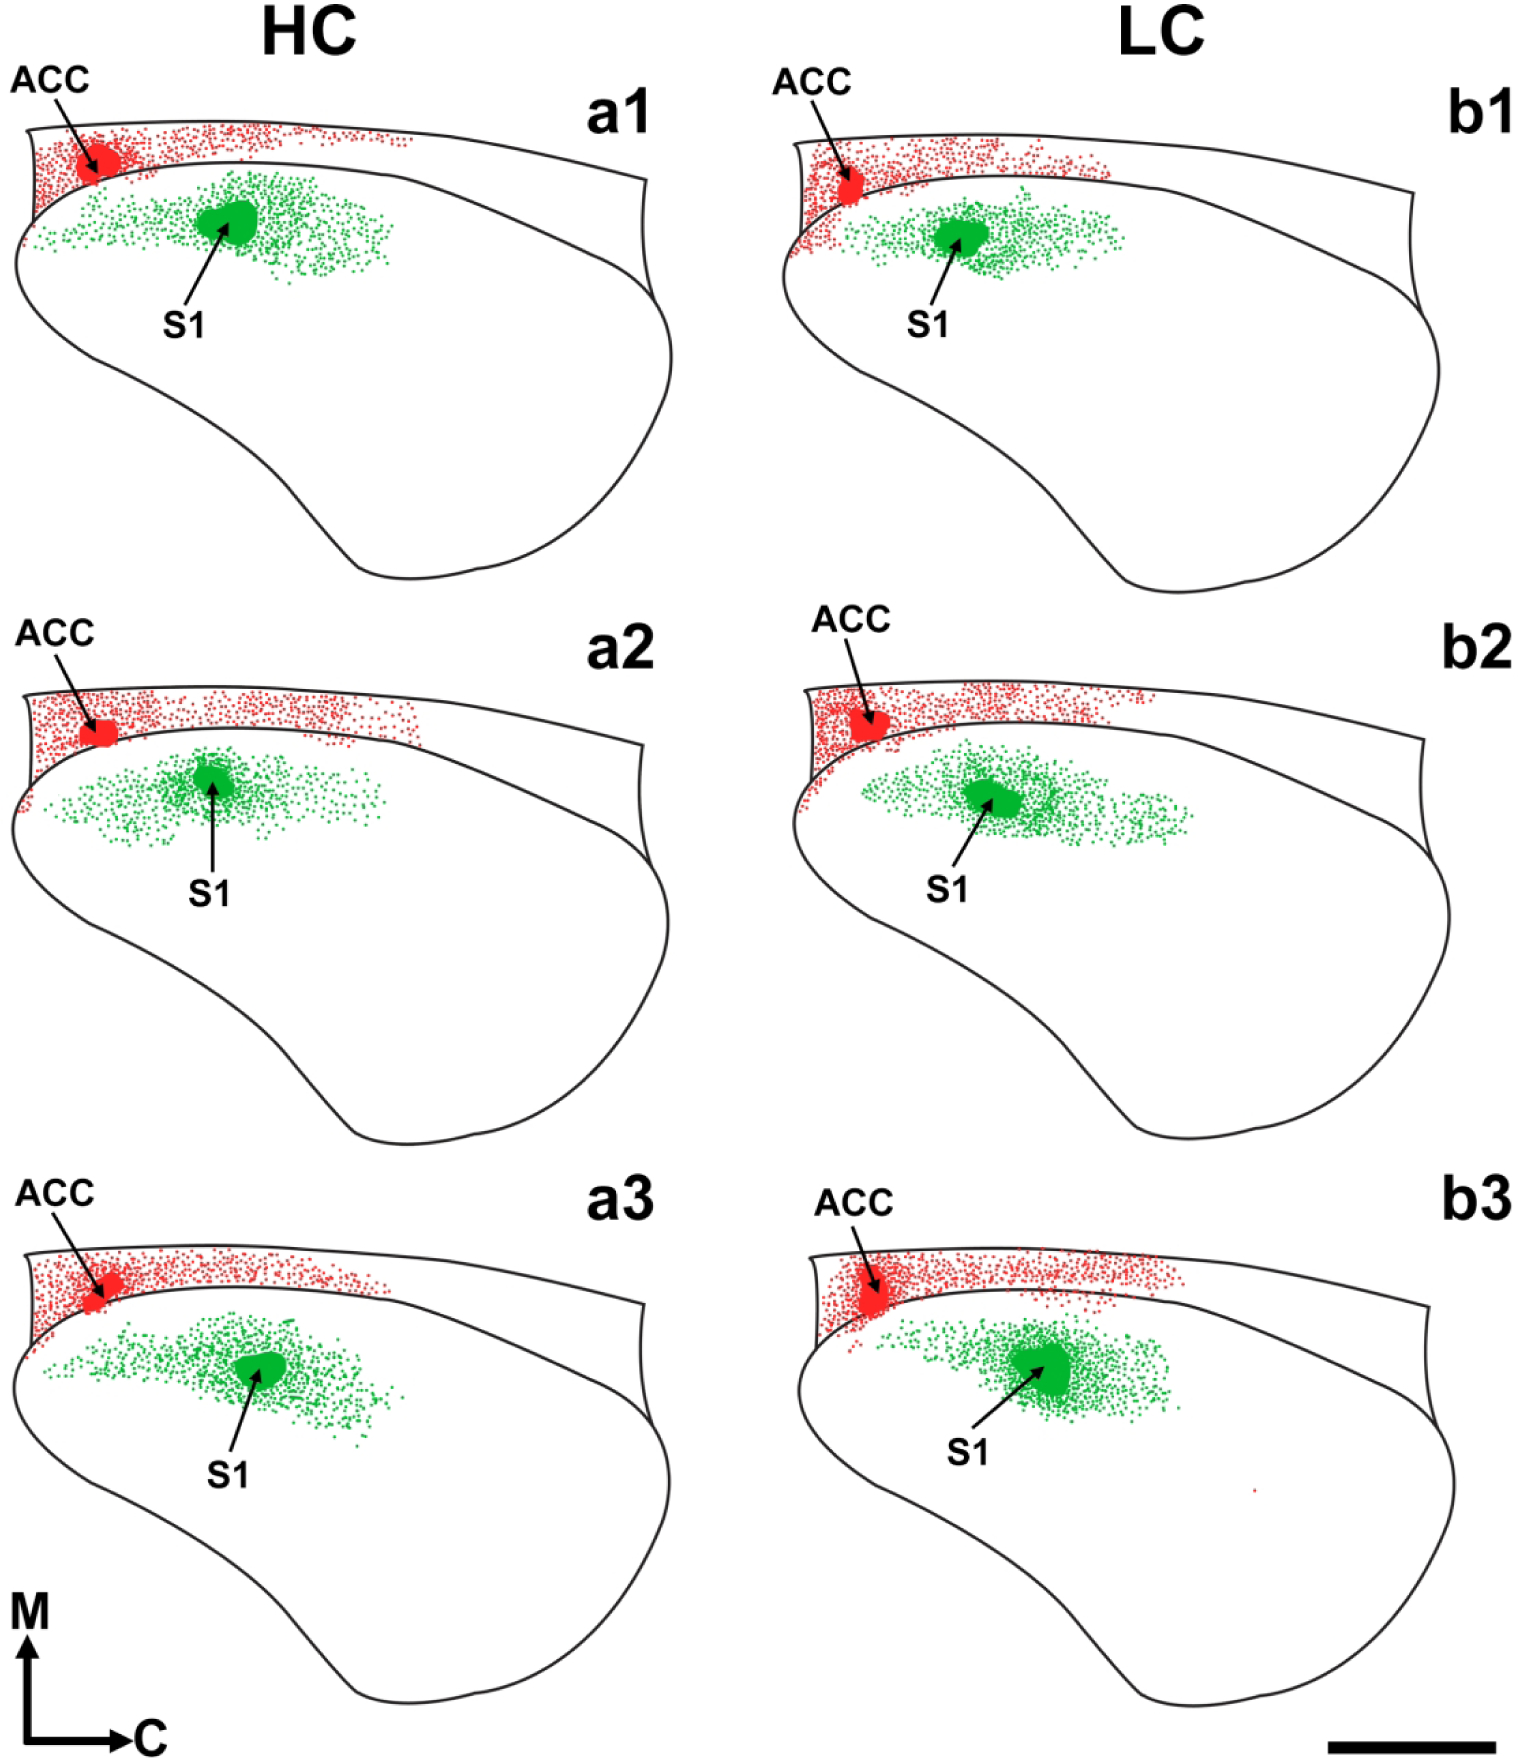
Figure 4. Flattened reconstructions of LC and HC brains at P1.

Drawn, ‘flattened’ neocortex images, reconstructed from coronal sections of three different HC (a1–3) and LC (b1–3) brains illustrating the retrograde connections of ACC (red) and S1 (green) at postnatal day 1. A standard cortical outline with dorsal, ventral, rostral, and caudal limits was applied to all cases for the transformation of serial coronal sections into reconstructed flattened cortical image. Black lines: Cortical outline; arrow/red patches: DiI anterior cingulate dye placement locations (DPLs); arrow/green patches: DiA somatosensory DPLs; green/red dots: Retrogradely labeled cell bodies. Reconstructions are oriented medial (M) up and caudal (C) to the right. Scale bar =1,000 μm.
