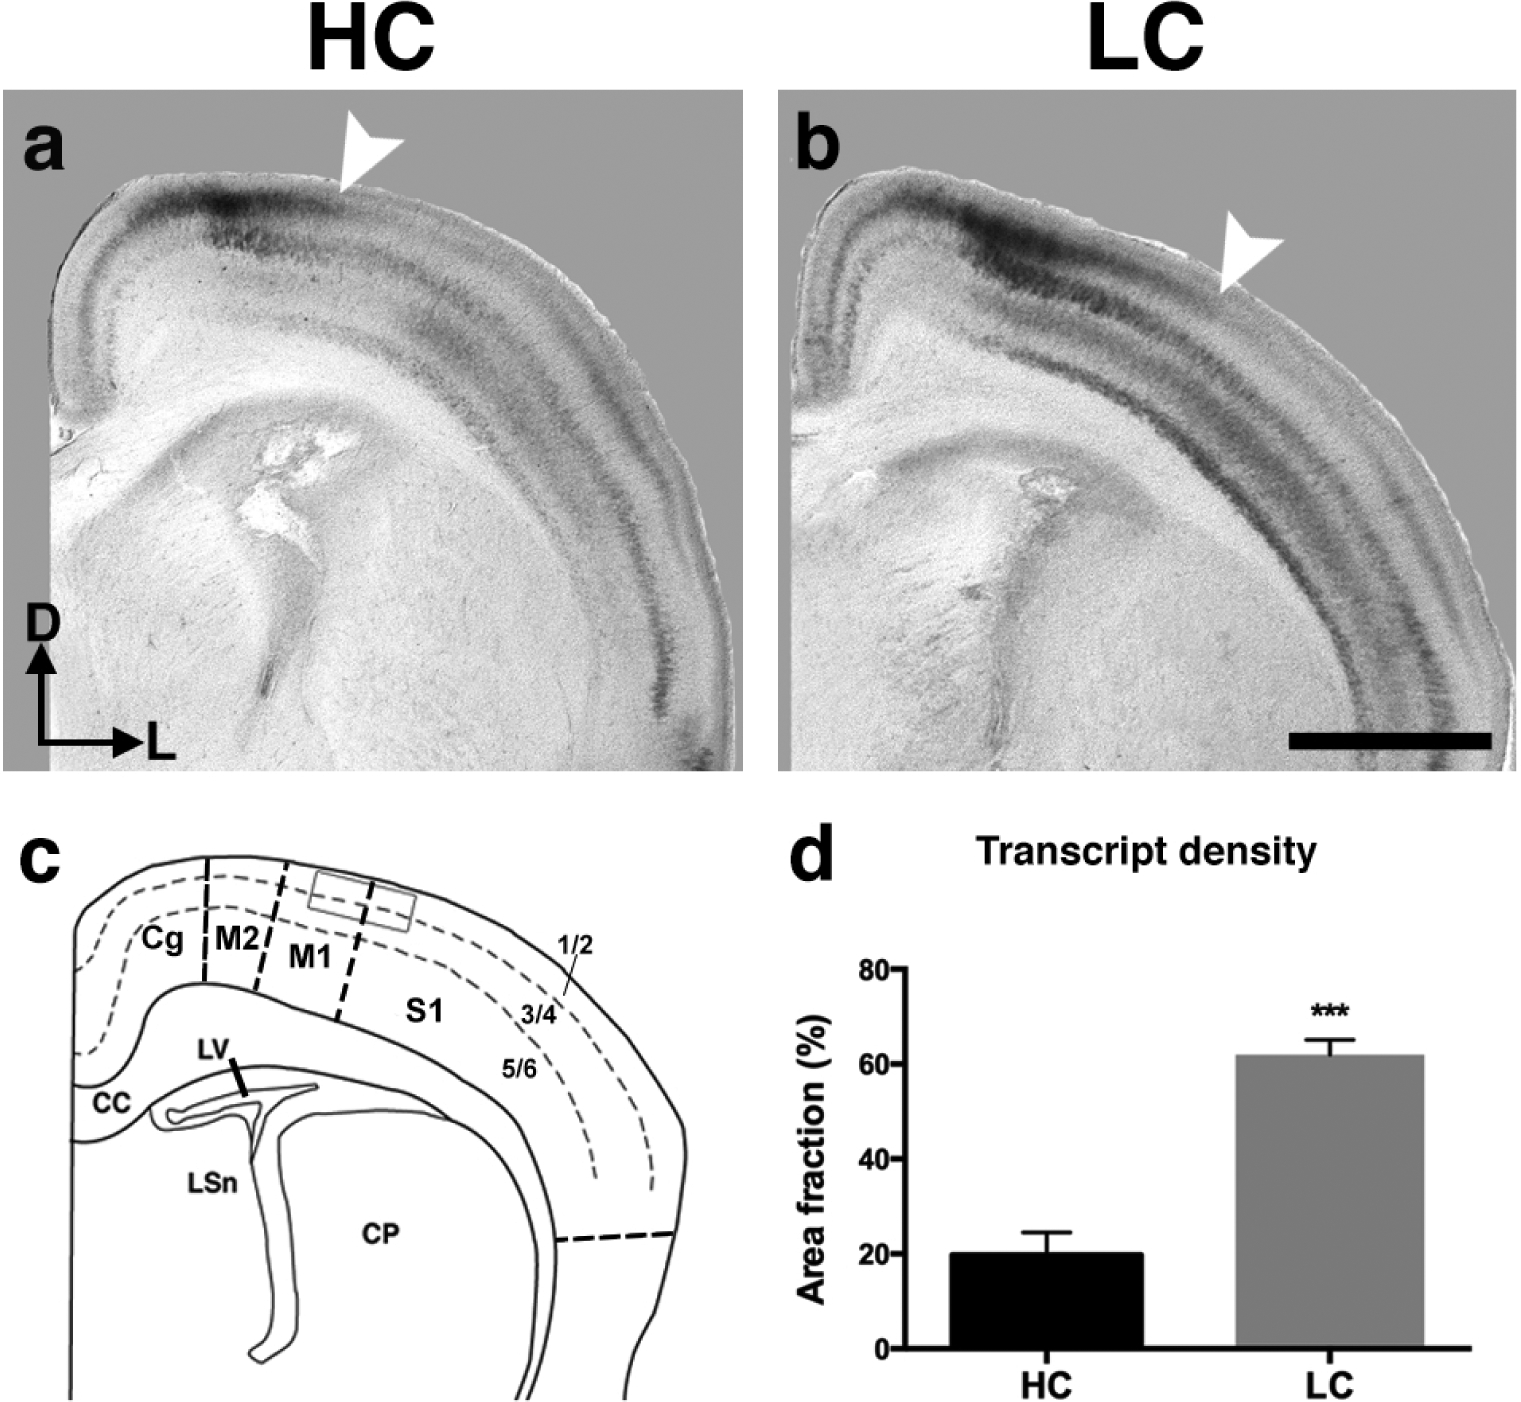
Figure 7. Semi-quantitative analysis of Id2 transcript density within somatosensory cortex ROI.

a, b, Representative coronal sections of HC (a) and LC (b) P1 vole hemispheres hybridized to Id2. Note the lateral shift in layer II/III Id2 expression in LC voles (arrow, b) compared to HC voles (arrow, a). c, Line drawing of the anatomical level (using Paxinos et al., 2007 as a guide) in which a static electronically-drawn region of interest (ROI) was placed on sections of binary-converted ISH experiments to quantify levels of mRNA expression. d, LC brains display an increase in Id2 transcript densities compared to HC in the ROI defined in (c) (***p=0.008, Student’s t). Bars represent group means ± SEM. ISH images and line drawing oriented dorsal (D) up, lateral (L) right. Scale bar = 1,000 μm.
