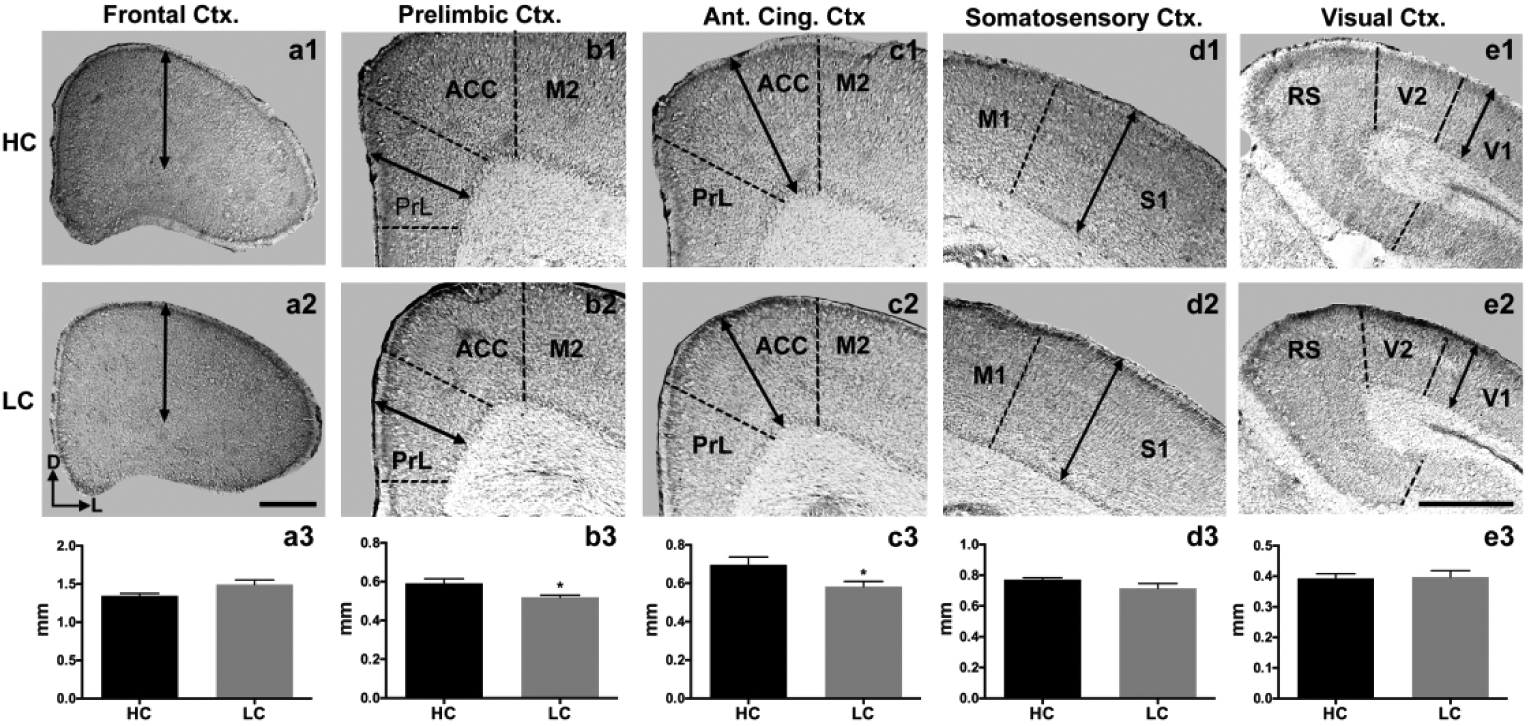
Figure 9. Cortical thickness at P1.

Coronal 40 μm sections in HC (top row, a1–e1) and LC P1 voles (middle row, a2–e2). Arrows indicate measurements of cortical thickness. No differences were observed in putative frontal cortex (a3), somatosensory (d3), and visual cortices (e3). However, a significant reduction was detected in putative prelimbic (b3; *p < 0.05) and anterior cingulate cortex (c3; *p < 0.05) in the LC group compared to HC voles. Bars represent group means ± SEM. Images oriented dorsal (D) up, lateral (L) left. Scale bar in (a2) applies to (a1–2). Scale bar in (e2) applies to all images in (b–e). Both scale bars = 500 μm.
