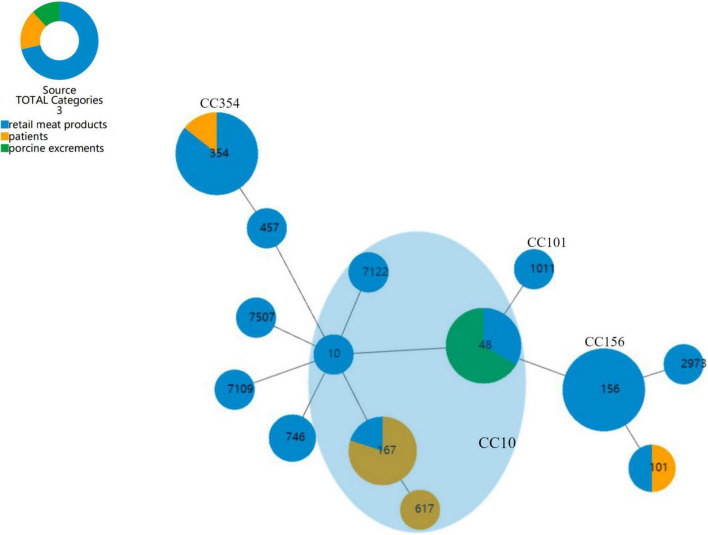
FIGURE 3.
goeBURST full MST analysis of 14 STs of E. coli. Each circle represents an ST, and the size of the circle reflects the frequency of each ST in the dataset; the number of different alleles is presented as STs, and the line between each circle is presented as distance labels (label edges with level value). CC represents a unique clonal complex. The shaded area represents the clonal complex 10.

