FIG. 5.
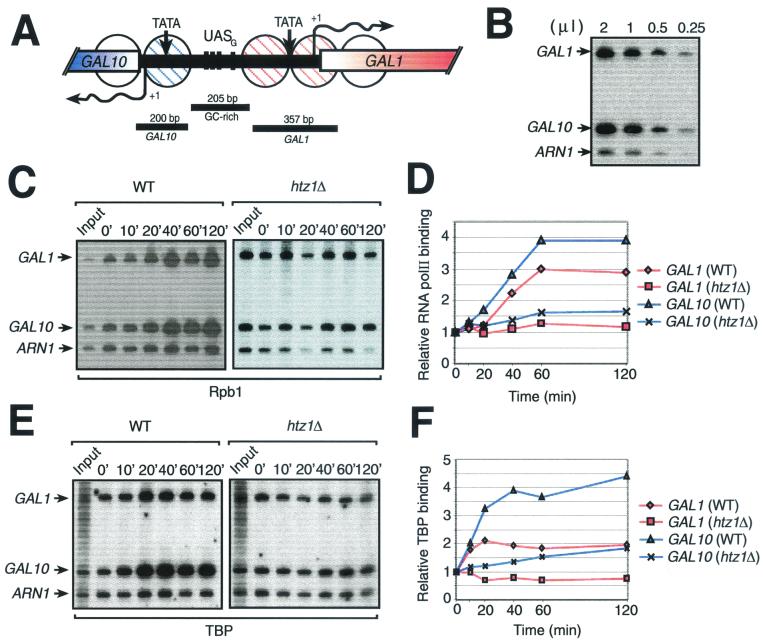
Effect of a htz1Δ mutation on recruitment of the transcriptional machinery to the GAL1-10 locus after galactose induction. (A) Representation of the GAL1-10 locus. GAL1 and GAL10 TATA boxes (TATA), transcriptional initiation sites (arrows with +1), and partial open reading frames are represented. The four Gal4 UASs (UASG) are shown by black crossbars. Circles, positioned nucleosomes covering both GAL1 and GAL10 promoters; stippling, remodeled nucleosomes during galactose induction (24); black bars, regions amplified by PCR in the ChIP experiments shown in panels B, C, and E. (B) Linear PCR amplification of DNA. (C) ChIP analysis of the binding of Rpb1 to the GAL1 and GAL10 promoters. The relative binding of Rpb1 over time after addition of galactose is shown for both wild-type (WT) and htz1Δ strains. ARN1 is used here as an internal control to normalize signals from each lane. (D) Binding of Rpb1 to the GAL1 and GAL10 promoters. Quantification of the experiment illustrated in panel C is shown. (E) ChIP analysis of the binding of TBP to the GAL1 and GAL10 promoters. The procedure was the same as for panel C except that the immunoprecipitation was carried out with an anti-TBP antibody. (F) Binding of TBP to the GAL1 and GAL10 promoters. Quantification of the experiment illustrated in panel E is shown.

