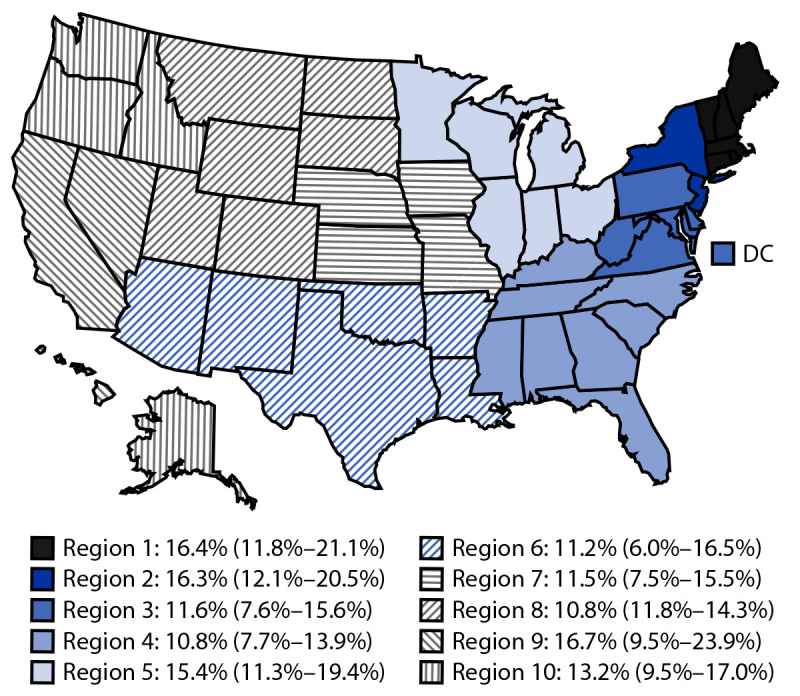
FIGURE.

Estimated prevalence* of current drinking† among pregnant adults aged 18–49 years (N = 6,327), by U.S. Department of Health and Human Services regions§ — Behavioral Risk Factor Surveillance System, United States, 2018–2020
Abbreviation: DC = District of Columbia.
* Percentages weighted to represent national estimates of the U.S. population. Estimates for Region 9 and Region 6 might be unstable because the relative SEs are 0.2–0.3.
† Defined as having consumed at least one alcoholic drink in the past 30 days.
§ Region 1: Connecticut, Maine, Massachusetts, New Hampshire, Rhode Island, and Vermont; Region 2: New Jersey and New York; Region 3: Delaware, District of Columbia, Maryland, Pennsylvania, Virginia, and West Virginia; Region 4: Alabama, Florida, Georgia, Kentucky, Mississippi, North Carolina, South Carolina, and Tennessee; Region 5: Illinois, Indiana, Michigan, Minnesota, Ohio, and Wisconsin; Region 6: Arkansas, Louisiana, New Mexico, Oklahoma, and Texas; Region 7: Iowa, Kansas, Missouri, and Nebraska; Region 8: Colorado, Montana, North Dakota, South Dakota, Utah, and Wyoming; Region 9: Arizona, California, Hawaii, and Nevada; Region 10: Alaska, Idaho, Oregon, and Washington.
