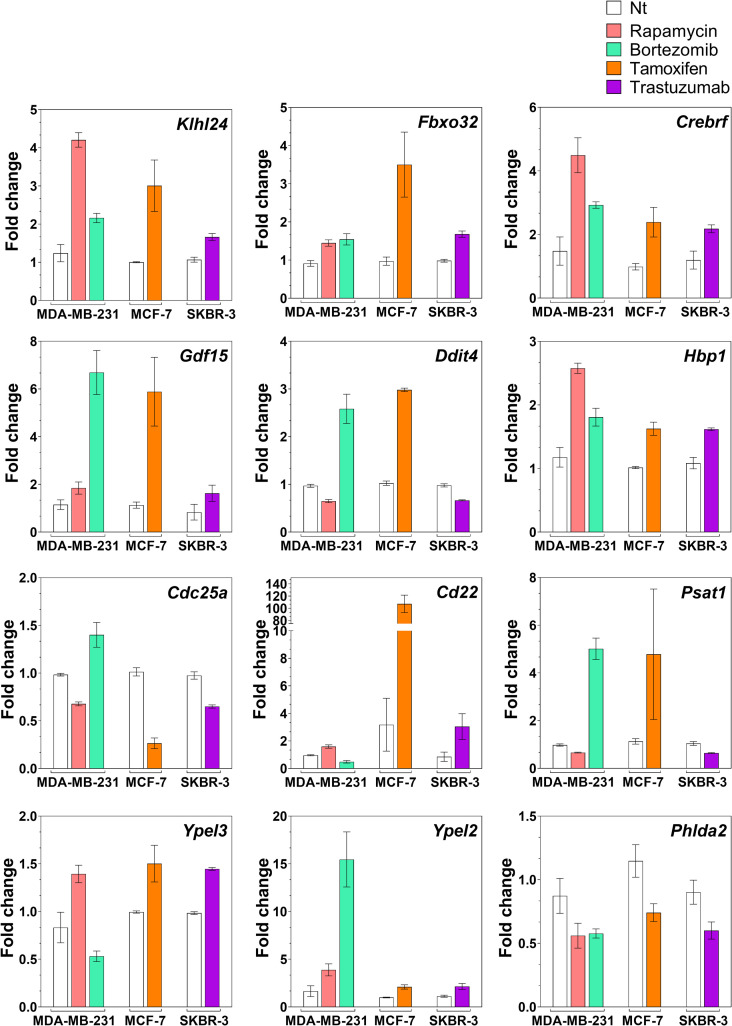
Fig 2. RNA sequencing data on the drug-independent cell-independent signature.
Relative expression of the 12 mRNAs plotted as fold change over the non-treated for each drug and cell line. The mRNAs were selected from the lists of differentially expressed genes between no treatment and drug treatment in each group with p ≤ 0.05 and -0.5 ≤ log2FC ≤ +0.5. FC = fold change.

