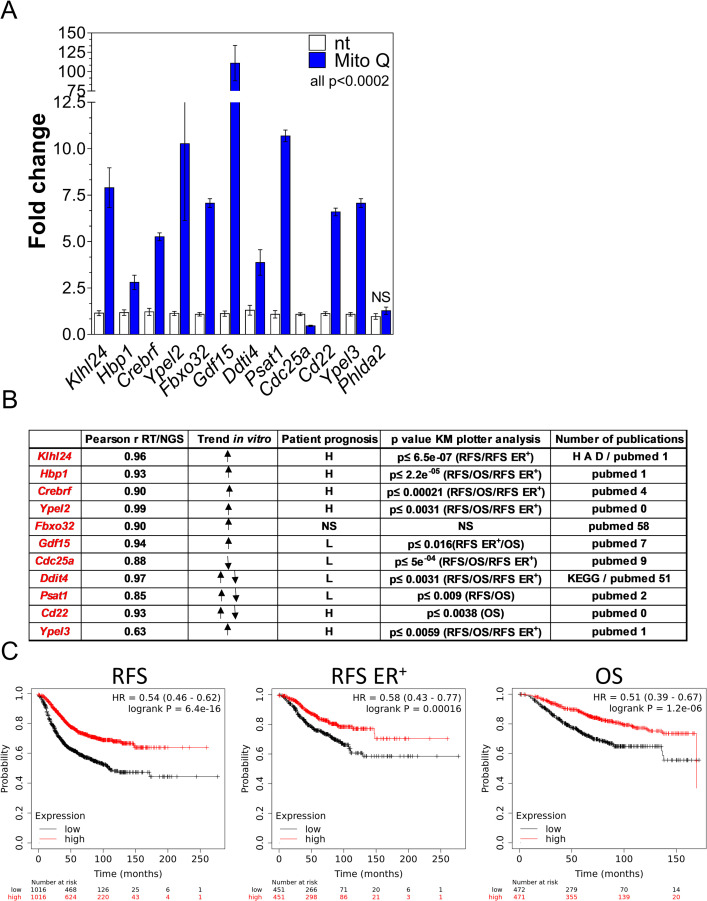
Fig 4. Testing the autophagy mRNA signature in an independent cohort of mRNAs in vitro and in a database of samples from breast cancer patients.
A) MDA-MB-231 cells were treated with 5 μM mitoquinone (Mito Q), a well characterized inducer of autophagy, for 16 hours. Relative expression levels of the mRNAs from the autophagy signature were verified by Q-RT-PCR and depicted in the graph as fold change upon untreated levels. B) The table lists: Pearson r value of correlation between RNA Q-RT-PCR data and sequencing data; trend of the expression of the mRNA after the drug treatments where ↑ means upregulation, ↓ means downregulation and ↑↓ means upregulated or downregulated depending on the drug/cell line; correlation with better patient prognosis in different outcomes such as relapse-free survival (RFS), overall survival (OS), relapse-free survival in ER+ patients only (RFS ER+) with high levels of mRNA expression (H) or low levels of mRNA expression (L); NS = non-significant p ≥ 0.05; Higher p value for the outcome correlations described in the previous column; Number of publications on PubMed with the term search “autophagy and mRNA gene symbol” as of April 2021 and the presence of the mRNA in the human autophagy database (HAD) or in the Kyoto Encyclopedia of Genes and Genomes (KEGG) as associated with an autophagy pathway. C) Cox Proportional Hazards Regression for the group of 11 mRNAs. High (red line) or low (black line) levels of the average 11 gene expression values are correlated with patient’s outcomes with KM Plotter software. Patients’ outcomes studied are: RFS (relapse-free survival), OS (overall survival) and RFS for ER positive patients only. P values are in the top left of each graph.

