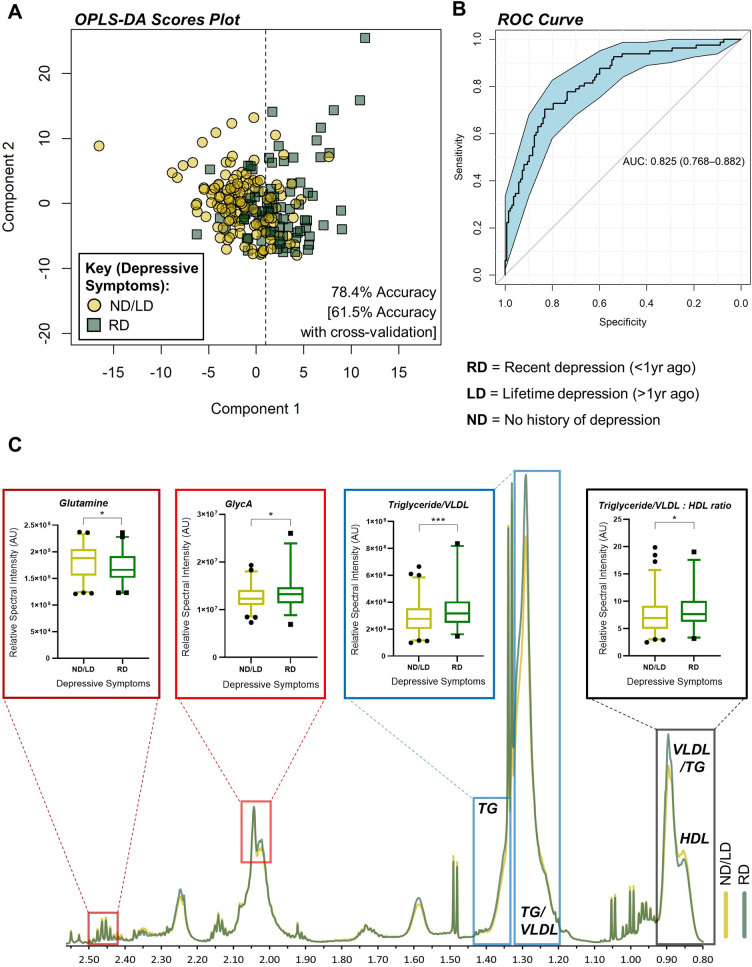
Fig 1. Nuclear magnetic resonance spectroscopy (NMR) identifies a serum metabolic signature of recent depressive symptoms in NAFLD.
A) Orthogonal partial least squares discriminate analysis (OPLS-DA) scores plot, based on integrated clinical and metabolomic data, coloured by depressive symptoms. R2X = 79.0±1.8%, R2Y = 27.4±2.9%, Q2 = 4.4±5.3%. B) Receiver operating characteristic (ROC) curve for the OPLS-DA scores, classifying recent vs. lifetime/no depressive symptoms. C) Visualisation of NMR spectrum illustrating the key resonance peaks contributing to the OPLS-DA model, including serum glutamine (Welch’s unequal variances t-test with Bonferroni’s correction, p = 0.048), VLDL/triglycerides (p = 0.0084), the VLDL/triglyceride:HDL ratio (p = 0.034) and GlycA (p = 0.013). ROC curve shows AUC ± 95% confidence intervals. N = 81 (recent depression) and 137 (lifetime/no depression).

