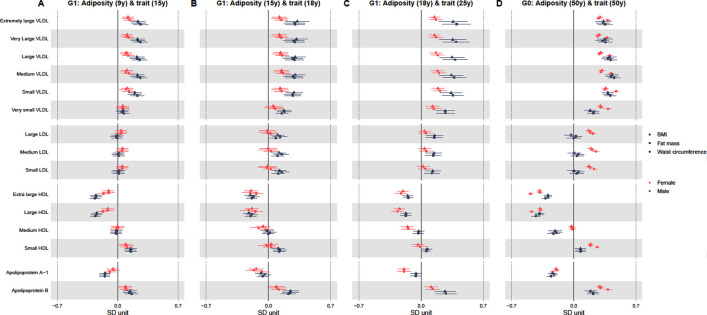
Fig 2. Sex-specific association of BMI, fat mass, and waist circumference (per SD increase) with standardised lipoprotein concentrations from childhood to midlife.
Results shown are standardised differences with whiskers representing 95% CIs. These represent the standardised difference in cardiometabolic trait per SD increase in BMI, fat mass, and waist circumference in each sex separately for associations of adiposity at 9 y and traits at 15 y (A), adiposity at 15 y and traits at 18 y (B), adiposity at 18 y and traits at 25 y (C), and adiposity at 50 y and traits at 50 y (D). G1 analyses are adjusted for age at clinic completion, ethnicity, child’s mother and father education, maternal smoking during pregnancy, birth weight, gestational age, maternal age, household social class, and height and height2. Analyses of outcomes at 18 y and 25 y are also additionally adjusted for G1 offspring smoking. G0 analyses are adjusted for age at clinic completion, ethnicity, education, smoking during G1 cohort pregnancy, own social class, and height and height2. SD unit of BMI = 2.7 kg/m2, 2.9 kg/m2, 3.8 kg/m2, and 4.8 kg/m2 at 9 y, 15 y, 18 y, and 50 y, respectively. SD unit of fat mass = 5 kg, 7.8 kg, 9.8 kg, and 10.2 kg at 9 y, 15 y, 18 y, and 50 y, respectively. SD unit of waist circumference = 7.4 cm, 7.8 cm, and 13 cm at 9 y, 15 y, and 50 y, respectively. BMI, body mass index; CI, confidence interval; G0, parent generation 0; G1, offspring generation 1; HDL, high-density lipoprotein; LDL, low-density lipoprotein; SD, standard deviation; VLDL, very-low-density lipoprotein.

