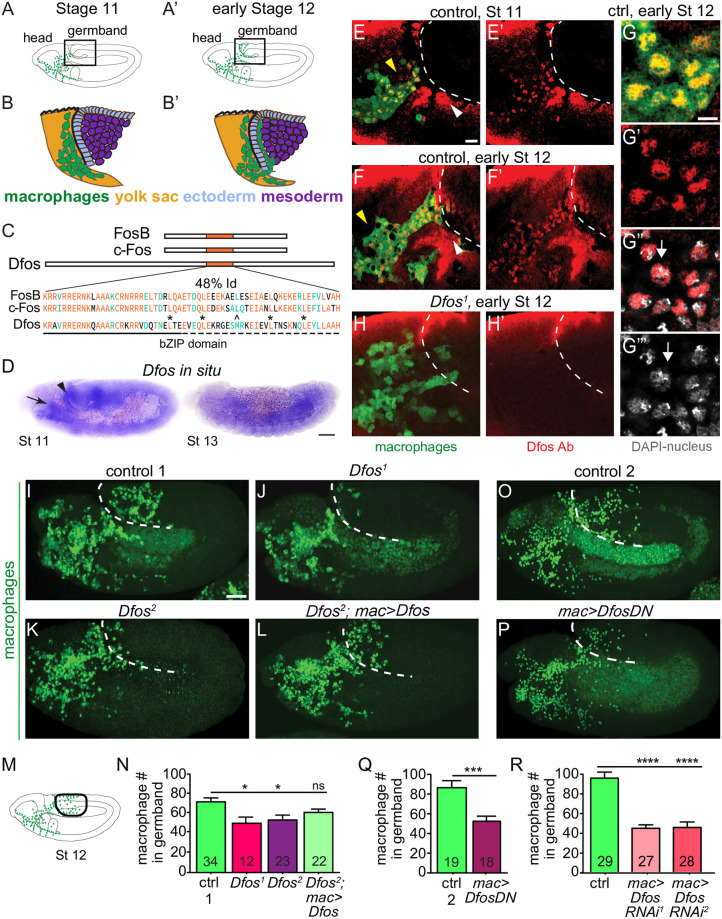
Fig 1. The bZIP transcription factor Dfos acts in macrophages to facilitate their migration into the gb.
Schematics of lateral (A) stage (St) 11 and (A’) early St 12 embryos. The boxed region magnified below indicates where macrophages (green) invade the gb after moving there from the head (B-B’). Macrophages sit on the yolk sac (yellow) next to the amnioserosa (black line) and then invade between the ectoderm (blue) and mesoderm (purple). (C) Dfos protein aligned with its human orthologs c-Fos and FosB; orange outlines the bZIP region that has 48% identity to both proteins: identical amino acids shown in orange, conserved ones in green. Stars indicate Leucines in the zipper; ^ the third leucine, which in Dfos is a methionine, a tolerated substitution [32]. The lower solid line indicates the basic domain and the dotted line the leucine zipper (ZIP). (D) In situ hybridization of St 11 and 13 embryos with a riboprobe for Dfos-RB (Fbcl0282531), which also detects all Dfos isoforms. Dfos RNA expression is enriched in macrophages (arrow) and the amnioserosa (arrowhead) before gb invasion but is gone thereafter. (E-H’) Confocal images of the boxed region in A from fixed embryos expressing GFP in macrophages (green) stained with a Dfos Ab (red). (E-F’, H-H’) A white dashed line indicates the gb edge. (E, F) The Dfos Ab stains (E) macrophages moving toward the gb at St 11 (yellow arrowheads), and (F) early St 12, as well as the amnioserosa (white arrowheads). (G) Higher magnification shows Dfos colocalizing with the nuclear marker DAPI (white). (H) No staining is detected in macrophages or the amnioserosa in the null Dfos1 mutant. (I-L) Lateral views of mid St 12 embryos from (I) the control, (J) the null allele Dfos1, (K) the hypomorphic allele Dfos2, and (L) Dfos2 with Dfos reexpressed in macrophages. (M) Schematic of St 12 embryo, gb region indicated by a black oval outline. (N) Quantitation reveals that both Dfos alleles display fewer macrophages in the gb. Reexpression of Dfos in macrophages in the Dfos2 hypomorph significantly rescues the defect. Control vs. Dfos1 p = 0.02 (30% reduction), Control vs. Dfos2 p = 0.017 (25% reduction), Control vs. Dfos2; mac>Dfos p = 0.334. (O-P) Lateral views of mid St 12 embryos from (O) the control, or (P) a line expressing a DN form of Dfos in macrophages. (Q) Quantification of macrophage numbers in the gb (see schematic) in the 2 genotypes visualized in O-P. p = 0.0002 (40% reduction). SD: 25, 25. (R) Quantification of macrophage numbers in the gb of the control and 2 different lines expressing RNAi constructs against Dfos in macrophages. Quantification of macrophage numbers in the gb for lines expressing one of 2 different UAS-Dfos RNAi constructs in macrophages. Control vs. mac>Dfos RNAi1 (TRiP HMS00254) or vs. mac>Dfos RNAi2 (TRiP JF02804), p < 0.0001 (54% or 52% reduction). SD: 32, 19, 29. The data in Q and R argue that Dfos is required within macrophages to promote gb tissue invasion. Embryos are positioned with anterior to left and dorsal up in all images, and histograms show mean + SEM throughout. Macrophages are labeled using srpHemo-Gal4 (“mac>”) driving UAS-GFP in E-H, UAS-GFP::nls in I-L and srpHemo-H2A::3xmCherry in O-R. ***p < 0.005, **p < 0.01, *p < 0.05. One-way ANOVA with Tukey post hoc was used for N and R, and unpaired t test for Q. The embryo number analyzed is indicated within the relevant column in the graphs. Scale bar: 50 μm in D, 5 μm in E-H, and 10 μm in I-L, O-P. The data underlying the graphs can be found in S1 Data. bZIP, basic leucine zipper domain; DN, dominant negative; gb, germband; RNAi, RNA interference; SD, standard deviation; SEM, standard error of the mean.

