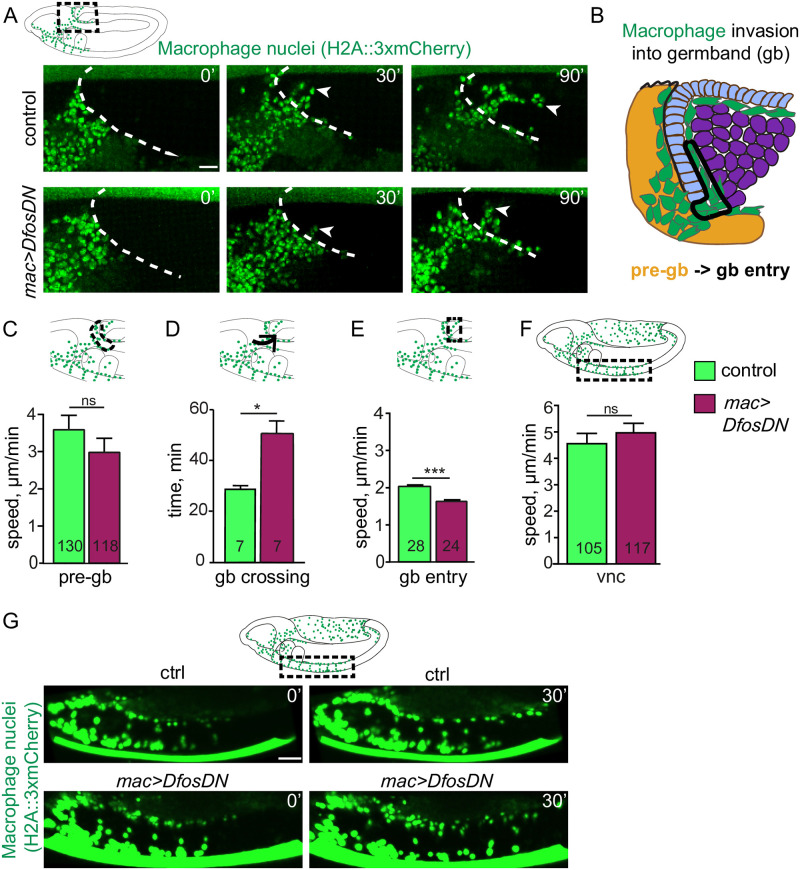
Fig 2. Dfos facilitates the initial invasion of macrophages into the gb tissue.
(A) Movie stills of control embryos and those expressing DfosDN in macrophages (green, nuclei labeled using srpHemo-H2A::3xmCherry). Area imaged corresponds to the black dashed square in the schematic above. The gb border is outlined with a white dashed line. The first entering macrophage is indicated with a white arrowhead, and time in minutes in the upper right corner. (B) Detailed schematic showing the different zones for which the parameters of macrophage gb invasion were quantified. The pre-gb area is shown in yellow, the gb entry zone is outlined in a solid line. (C) Macrophage speed in the pre-gb area was not significantly changed in macrophages expressing DfosDN (3.00 μm/min) compared to the control (3.61 μm/min), p = 0.58. (D) Quantification shows a 68% increase in the total gb crossing time of DfosDN expressing macrophages compared to the control. Total gb crossing time runs from when macrophages have migrated onto the outer edge of the gb ectoderm, aligning in a half arc, until the first macrophage has translocated its nucleus into the gb ecto–meso interface. p = 0.008. SD: 4, 14. (E) DfosDN expressing macrophages displayed a significantly reduced speed (1.53 μm/min) at the gb entry zone compared to the control (1.98 μm/min), p = 1.11e−06. SD: 2, 2. (F) Macrophages expressing DfosDN in a Stage 13 embryo move with unaltered speed along the vnc in the region outlined by the dashed black box in the schematic above (4.93 μm/min), compared to the control (4.55 μm/min), p = 0.64. Corresponding stills shown in (G) Macrophages are labeled by srpHemo-Gal4 driving UAS-GFP::nls. ***p < 0.005, **p < 0.01, *p < 0.05. Unpaired t test used for C-F, a Kolmogorov–Smirnov test for D. For each genotype, the number of tracks analyzed in C and F and the number of macrophages in D-E are indicated within the graph columns. Tracks were obtained from movies of 7 control and 7 mac>DfosDN expressing embryos in panel D, 3 each in C, F, and 4 each in E. Scale bar: 10 μm. The data underlying the graphs can be found in S1 Data. gb, germband; ns, not significant; SD, standard deviation; vnc, ventral nerve cord.

