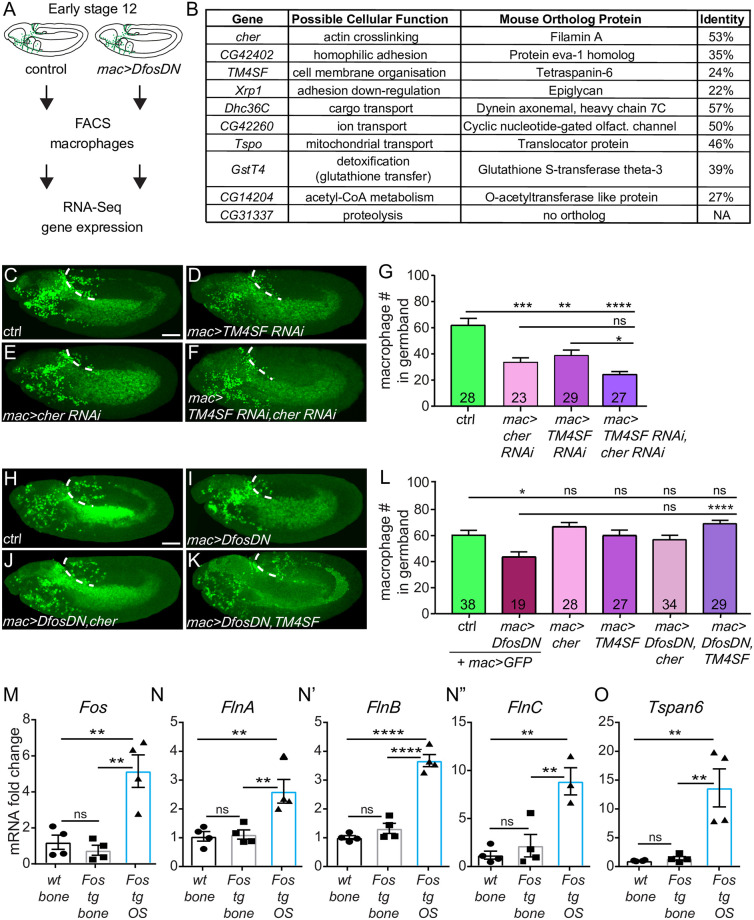
Fig 3. Dfos regulates macrophage gb invasion through cytoskeletal regulators: The filamin Cher and the tetraspanin TM4SF.
(A) Schematic representing the pipeline for analyzing mRNA levels in FACS-sorted macrophages. (B) Table of genes down-regulated in macrophages expressing DfosDN. Genes are ordered according to the normalized p-value from the RNA sequencing. The closest mouse protein orthologs were found using UniProt BLAST; the hit with the top score is shown in the table. (C-F) Lateral views of representative St 12 embryos in which the 2 targets with links to actin organization, (D) the tetraspanin TM4SF and (E) the filamin Cher, have been knocked down individually or (F) together, along with the control (C). Scale bar: 50 μm. (G) Quantification shows that the number of macrophages in the gb is reduced in embryos expressing RNAi against either cher (KK 107451) or TM4SF (KK 102206) in macrophages, and even more strongly affected in the double RNAi of both. Control vs. cher RNAi p = 0.0005 (46% reduction). Control vs. TM4SF RNAi p = 0.009 (37% reduction), Control vs. cher/TM4SF RNAi p > 0.0001 (61% reduction). cher RNAi vs. TM4SF RNAi p = 0.15. SD: 29, 23, 17, 12. (H-K) Lateral views of a representative St 12 embryo from (H) the control, as well as embryos expressing DfosDN in macrophages along with either (I) GFP, (J) Cher, or (K) TM4SF. (L) Quantification shows that overexpression of TM4SF in DfosDN expressing macrophages restores their normal numbers in the gb. Overexpression of Cher in this background shows a strong trend toward rescue but did not reach statistical significance. Control vs. DfosDN p = 0.015 (28% reduction); Control vs. cher p = 0.74; Control vs. TM4SF p > 0.99; DfosDN vs. DfosDN cher p = 0.14; DfosDN vs. DfosDN, TM4SF p < 0.0001; Control vs. DfosDN cher p = 0.97; Control vs. DfosDN TM4SF p = 0.35. SD: 22, 16, 16, 21, 22, 13. (M-O) q-PCR analysis of mRNA extracted from the bones of mice that are wt, tg for Fos controlled by a Major Histocompatibility promoter and viral 3′ UTR elements, and those in which such c-Fos transgenesis has led to an OS. Analysis of mRNA expression shows that higher levels of (M) Fos correlate with higher levels of (N-N”) FlnA-C, and (O) Tspan6 in OS. p-values = 0.86, 0.001, 0.003, SD: 0.7, 0.6, 0.3 in M, 0.98, 0.009, 0.007 and 0.4, 0.2, 1.5 in N, 0.39, <0.0001, <0.0001 and 0.2, 0,3, 1.1 in N’, 0.76, 0.005, 0.002 and 0.8, 2.3, 2.4 in N”, 0.99, 0.004, 0.003 and 0.1, 0.2, 0.2 in O. Scale bar: 50 μm. Macrophages are labeled using either (C-F) srpHemo-H2A::3xmCherry or (H-K) srpHemo-Gal4 (“mac>”) driving UAS-mCherry::nls. ***p < 0.005, **p < 0.01, *p < 0.05. Unpaired t test or one-way ANOVA with Tukey post hoc were used for statistics. Each column contains the number of analyzed embryos. The data underlying the graphs can be found in S1 Data. Cher, Cheerio; gb, germband; ns, not significant; RNAi, RNA interference; OS, osteosarcoma; tg, transgenic; wt, wild type.

