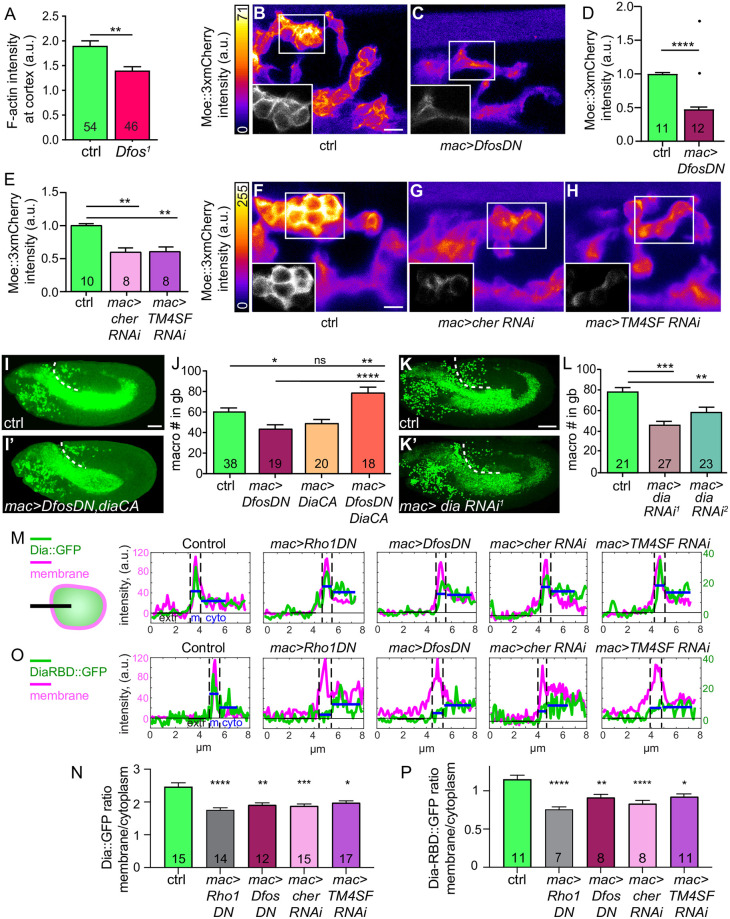
Fig 4. Dfos increases Rho1-GTP, the formin Diaphanous and actin at the cortex through Cher and TM4SF.
(A) Quantification of phalloidin intensity to detect F actin at the macrophage–macrophage contacts in Stage 11/12 Dfos1 embryos. F-actin is strongly reduced at these homotypic contacts. (B-C) Representative confocal images of live embryos expressing in invading macrophages the F-actin binding and homodimerizing portion of Moesin (srpHemo-moe::3xmCherry) to label F-actin, presented as a maximum z-projection. Relative Moe-3xmCherry intensity is indicated with a pseudo-color heat map as indicated on the left, with yellow as the highest levels and dark blue as the lowest as indicated in the calibration bar to the left. Insets in the bottom left corner of each panel show a grayscale single z-plane corresponding to the white box in the main image. Embryo genotype indicated below. Strong reductions in cortical actin are observed in macrophages expressing DfosDN compared to the control. (D-E) Quantification of the macrophage Moe:3xmCherry intensity as a measure of cortical F-actin, normalized to the average fluorescence intensity of the control per batch. (D) Quantification shows that macrophages expressing DfosDN display a 53% reduction in Moe::3xmCherry intensity compared to the control when the 2 outliers shown as single dots are excluded, 37% if they are included. Outliers identified by 10% ROUT. n of ROIs analyzed = 650 for control, 687 for DfosDN. p = 0.0007 for analysis including outliers (Kolmogorov–Smirnov) and p < 0.0001 for analysis excluding outliers (Welch’s t test). SD: 0.2, 0.4. (E) Quantification reveals that macrophage expression of an RNAi against either cher or TM4SF, the 2 genes whose expression is reduced in DfosDN, also results in a decrease of Moe::3xmCherry intensity (by 40% each). n of ROIs analyzed = 549 for control, 423 for cher RNAi, 306 for TM4SF RNAi. Control vs. cher RNAi p = 0.006. Control vs. TM4SF p = 0.003. SD: 0.2, 0.3, 0.2. (F-H) Images and representation as in B-C. Strong reductions in cortical actin are observed in macrophages expressing cher RNAi or TM4SF RNAi compared to the control. (I-I’) Representative confocal images of St 12 embryos from the control and a line in which macrophages express DfosDN and a CA form of the formin Dia to restore cortical actin polymerization. (J) Quantification shows that while macrophage expression of DiaCA does not significantly affect the number of macrophages in the gb, expressing it in a DfosDN background rescues macrophage gb invasion. Control vs. DfosDN p = 0.017 (28% reduction), Control vs. diaCA p = 0.18, Control vs. DfosDN, diaCA p = 0.010, DfosDN vs. DfosDN, diaCA p < 0.0001. SD: 22, 16, 16, 24. (K–K’) Representative confocal images of St 12 embryos from the control and from a line expressing an RNAi against dia in macrophages. (L) Quantification of 2 RNAi lines against dia expressed in macrophages shows a 37% and 21% reduction in macrophage numbers in the gb compared to control. Control vs. dia RNAi1 (TRiP HMS05027) p < 0.0001; control vs. dia RNAi2 (TRiP HMS00308) p = 0.0008. SD: 13, 20, 22. (M, O) Examples of line profiles used for the determination of the membrane-to-cytoplasmic ratio of Dia in panel N and the Rho1 activity sensor DiaRBD in panel P. Line intensity profiles from fixed Stage 11 embryos of (M) Dia::GFP or (O) DiaRBD::GFP (green) and membrane Myr::Tomato (magenta) across the outward facing edge of groups of macrophages sitting within approximately 40 μm of the gb that expressed either lacZ (Control), Rho1DN, DfosDN, cher RNAi, or TM4SF RNAi as shown in the schematic in M. Line length approximately 8 μm. Blue lines indicate mean GFP intensity on the membrane and in cytoplasm. (N, P) Quantification of membrane-to-cytoplasmic intensity ratio of (N) Dia::GFP or (P) the Rho1 activity sensor DiaRBD::GFP expressed in macrophages under UAS control along with either lacZ (control, n = 233 from 15 or n = 158 line scans from 11 embryos), Rho1DN (n = 212 from 14 or n = 123 from 7), DfosDN (n = 237 from 12 or n = 135 from 8), cher RNAi (n = 252 from 13 or n = 128 from 8), TM4SF RNAi (n = 279 from 17 or n = 205 from 11). Control vs. Rho1DN ****p < 0.0001 (29% (N), 34% (P) reduction), Control vs. DfosDN **p = 0.0037 (23% (N), 21% (P) reduction), Control vs. cher RNAi ***p = 0.0007, 24% reduction (N) or ****p < 0.0001, 28% reduction (P), Control vs. TM4SF RNAi *p = 0.024 or 0.026 (20% reduction). SD: 1.9, 0.9, 1.0, 0.9, 1.0 in N; 0.7, 0.5, 0.5, 0.5, 0.4 in P. Macrophages are labeled using either srpHemo-Gal4 driving UAS-mCherry::nls (I-I’), srpHemo-H2A::3xmCherry (K-K’). srpHemo-moe::3xmCherry, srpHemo-Gal4 (mac>) crossed to (B) UAS-GFP as a Control, (C) UAS-DfosDN, (F) w− Control, (G) UAS-cher RNAi (KK 107451), (H) UAS-TM4SF RNAi (KK 102206). srpHemo-GAL4 UAS-Myr::tdTomato UAS-dia::GFP (M, O) or UAS-diaRBD::GFP (N, P) crossed to UAS-lacZ as a Ctrl, UAS-Rho1DN or the lines indicated above. ****p < 0.0001, ***p < 0.005, **p < 0.01, *p < 0.05. Unpaired t test used for A. Welch’s t test of normalized average mean intensity per embryo for D with the 2 indicated outliers excluded, for statistical assessment. One-way ANOVA with Tukey post hoc for E, J, L. Kruskal–Wallis for N, P. The number of analyzed (A) macrophage–macrophage junctions, or (D-E, J, L, N, P) embryos is shown in each column. Scale bar 10 μm in (B-C, F-H), 50 μm in (I, K). The data underlying the graphs can be found in S1 Data. CA, constitutively active; Cher, Cheerio; ctrl, control; gb, germband; ns, not significant; RNAi, RNA interference; ROI, region of interest.

