Fig. 1.

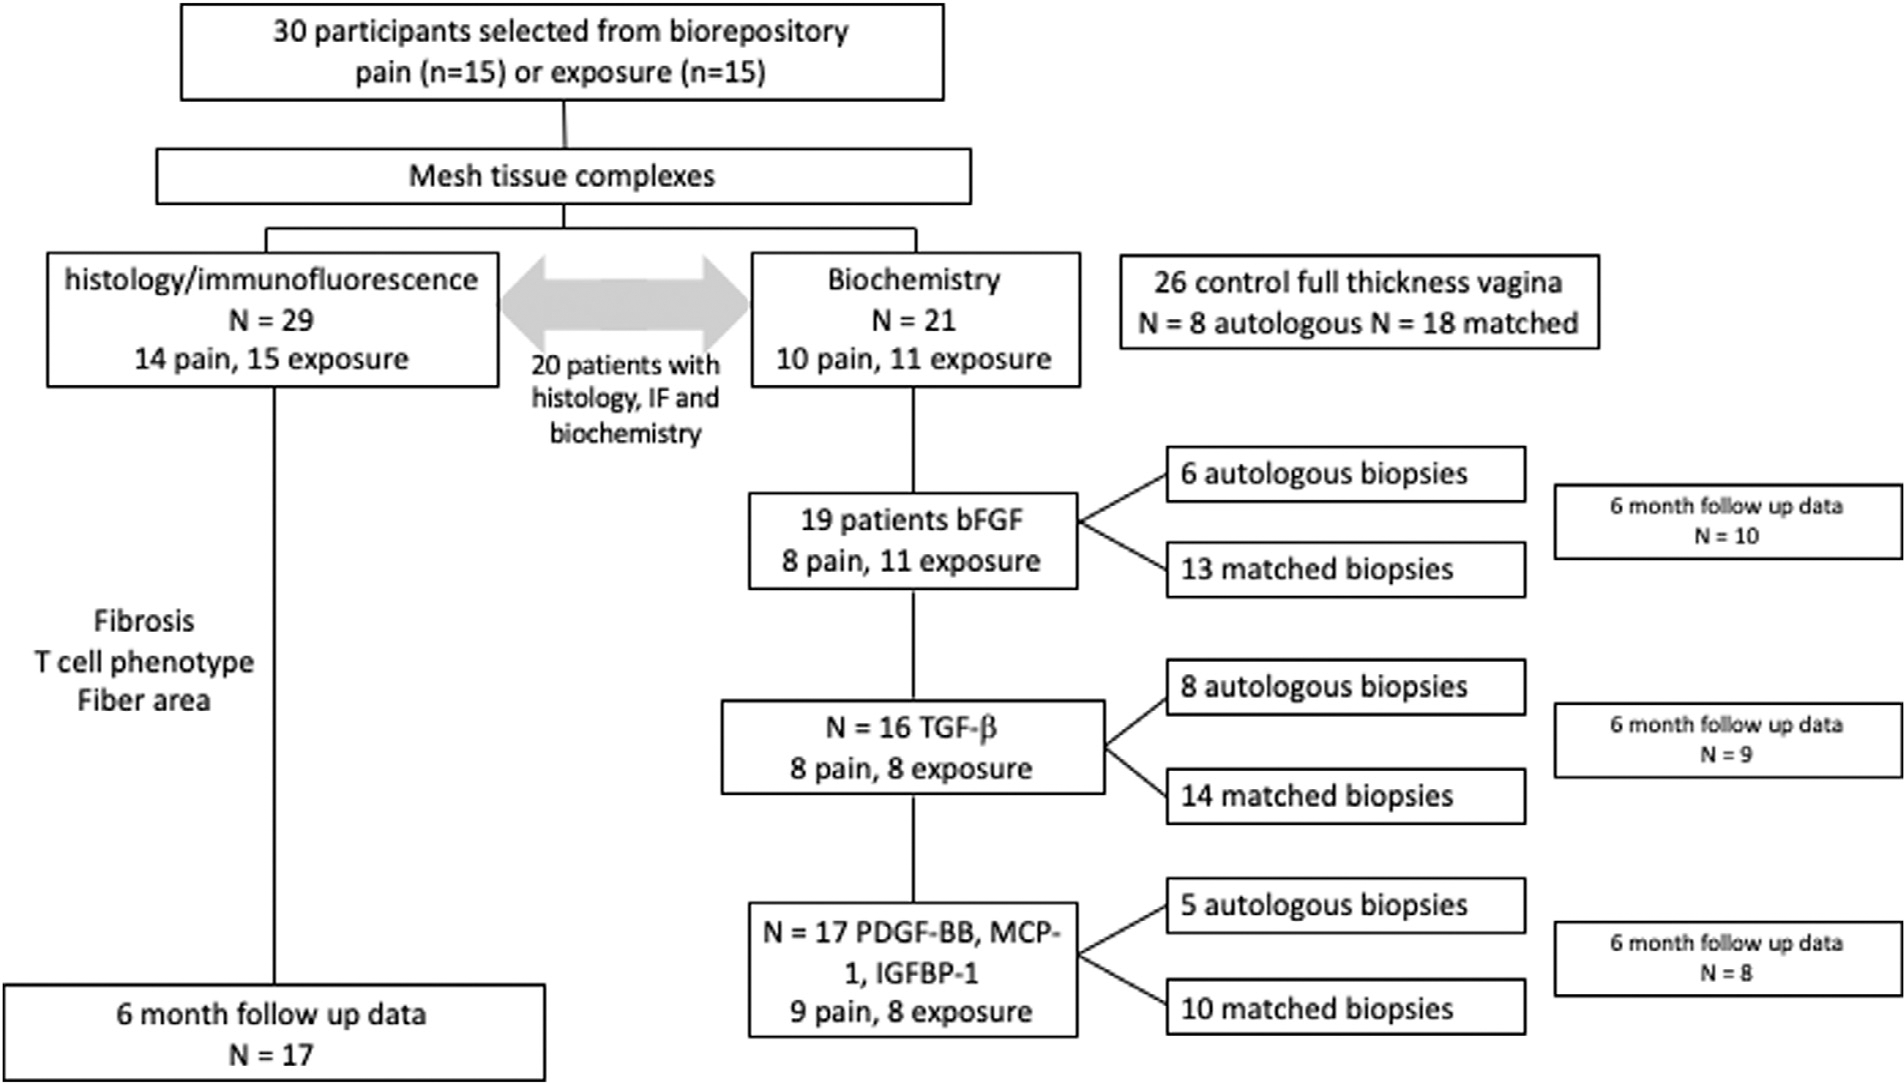
Flow chart demonstrating subgroups of patients in each analysis. Due to limited tissue for each sample and variable concentrations required for each assay, not every assay could be performed on each patient in this cohort.

Flow chart demonstrating subgroups of patients in each analysis. Due to limited tissue for each sample and variable concentrations required for each assay, not every assay could be performed on each patient in this cohort.