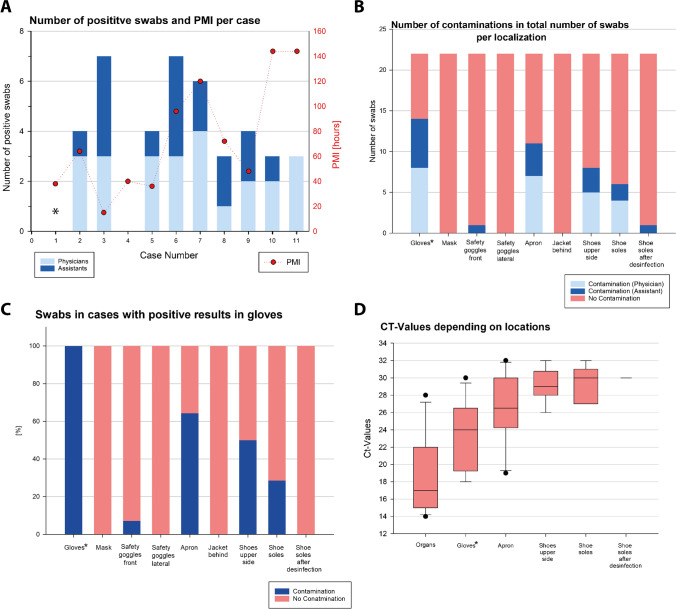
Fig. 2.
RT-PCR results from PPE. a Number of positive swabs per case divided according to physicians and assistants with corresponding PMI; b proportion of positive swabs from physicians and assistants in the various localizations; c results from PPE other than gloves in cases in which the gloves tested positive; d box plots of the Ct values by localization. Note: In one autopsy (AA1), swabs from the gloves were taken after disinfection

