
Figure 4.
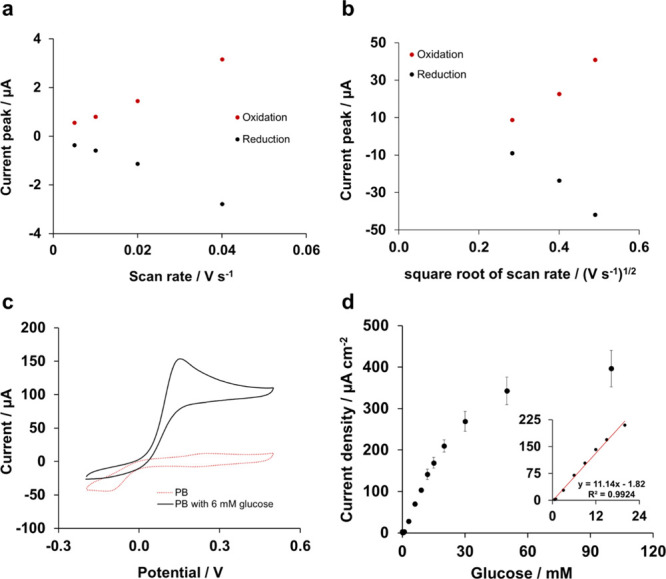
Characterization of the bioanode in 0.1 M phosphate buffer, pH 7.4. (a) Scan rate study for scan rate values lower than 40 mV s–1 and (b) scan rate study for scan rate values higher than 40 mV s–1. (c) Cyclic voltammograms of the bioanode GOx/Os/hPG/Au in air-equilibrated 0.1 M phosphate buffer, pH 7.4 in the presence and absence of 6 mM glucose. The CV curves were recorded versus Ag/AgCl at a scan rate of 5 mV s–1 and represent the I–V response for one independent electrode. (d) Chronoamperometric response at an applied potential of +0.22 V versus Ag/AgCl of the bioanode GOx/Os/hPG/Au to glucose (50 μM to 100 mM) in 0.1 M phosphate buffer, pH 7.4 (y = 11.14x −1.82, R2 = 0.9924). The inset corresponds to the linear range of the bioanode. Error bars refer to the standard error (n = 3).