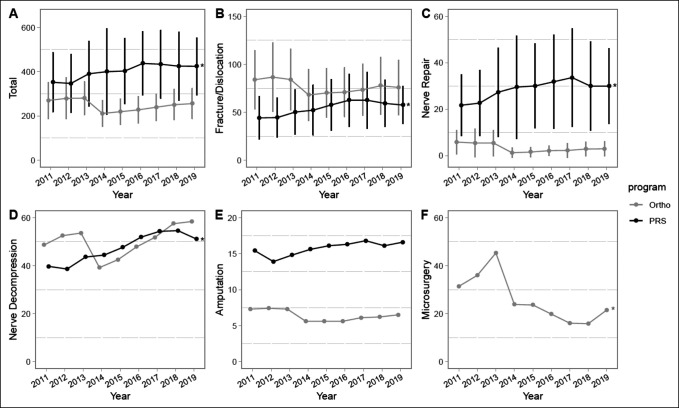
Figure 4.
Graphical representation showing mean total case volume (A) and mean case volume for four comparable categories (B–E) between plastic surgery (PRS) and orthopaedic surgery (ortho) residents during the entirety of residency training from academic years 2010 to 2011 to 2018 to 2019. F, Mean volume of microsurgery cases completed by orthopaedic residents during their training. Standard deviations marked with vertical bars, when the data were available. Significant differences between specialties (P < 0.05) noted in mean case volumes for the following categories over the entire study period: total, amputation, fracture/dislocation, and nerve repair. *P < 0.05 for linear regression trend over time.

