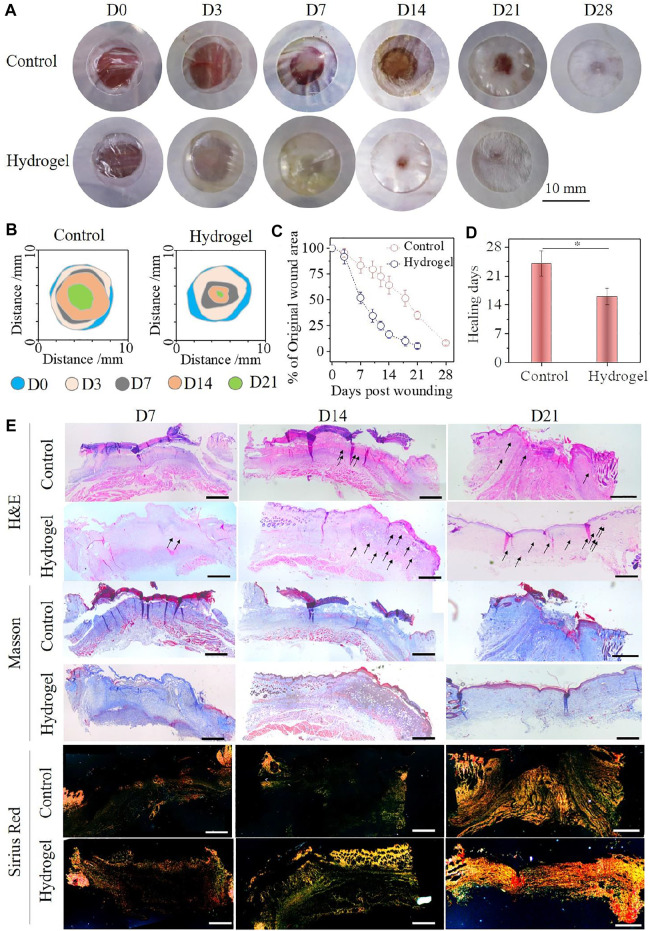
FIGURE 5.
(A) Representative photographs of the acute skin wounds after being treated with S4Q4G4 hydrogel group and Tegaderm film control groups at each time point. (B) Traces of wound-bed closure during 21 days for each treatment. (C) Wound closure curves with hydrogel and control treatments. (D) Average healing times for each treatment. (E) H&E, Masson’s trichrome stains, and Picrosirius red staining of wound tissues. Scale bar: 200 μm.

