. 2021 Dec 23;10:e72593. doi: 10.7554/eLife.72593

Figure 1. TCA cycle inhibition promotes cytosolic glutathione synthesis while impairing de novo proline and aspartate synthesis.

(A) Schematic diagram of comparative metabolomic approach to assess the metabolic response of kidney epithelial cells to TCAi. (B) Significantly increased metabolites (Cut-off = 25% change in abundance, false discovery rate (FDR) = 5%) with genetic or pharmacological TCAi. (C) Significantly decreased metabolites. (B–C) (24 hr timepoint). (D) Volcano plot of glutathione-related metabolites and amino acids in Fh1-/- versus Fh1fl/fl cells. (E) Volcano plot of glutathione-related metabolites and amino acids in Sdhb-/- versus Sdhbfl/fl cells. (F) Heatmap of mean scaled consumption-release (CoRe) intensity value of amino acids in Fh1-/- versus Fh1fl/fl cells. (B–F) (n = 5–10 independent biological replicates). (G) Volcano plot of glutathione-related metabolites and amino acids in FHIN-1 (20 μM)-treated Fh1fl/fl versus DMSO-vehicle control Fh1fl/fl cells. (H) Volcano plot of glutathione-related metabolites and amino acids in AA5 (1 μM)-treated Fh1fl/fl versus DMSO-treated Fh1fl/fl cells. (G–H) (24 hr timepoint) (n = 10–15 independent biological replicates). (I) Heatmap of mean scaled CoRe intensity value of amino acids in FHIN-1, AA5 and TTFA (500 μM) versus DMSO-treated Fh1fl/fl cells (24 hr timepoint) (n = 5 independent biological replicates). (D–I) p Value determined by multiple unpaired t-tests, corrected with two-stage step-up method of Benjamini, Krieger, and Yekutieli - FDR = 5%. p < 0.05*; p < 0.01**; p < 0.001***.

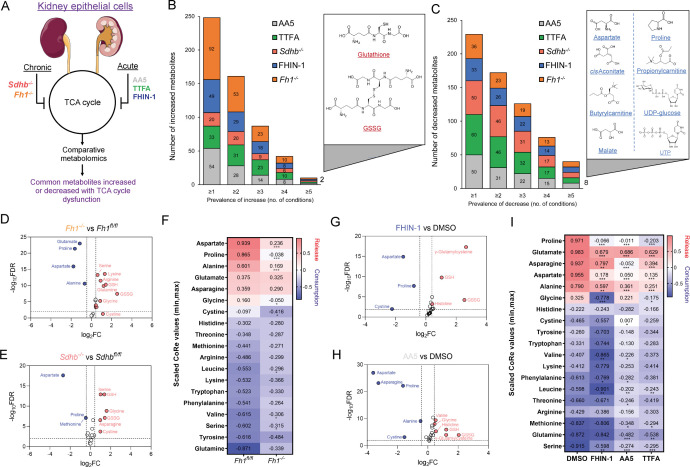
Figure 1.

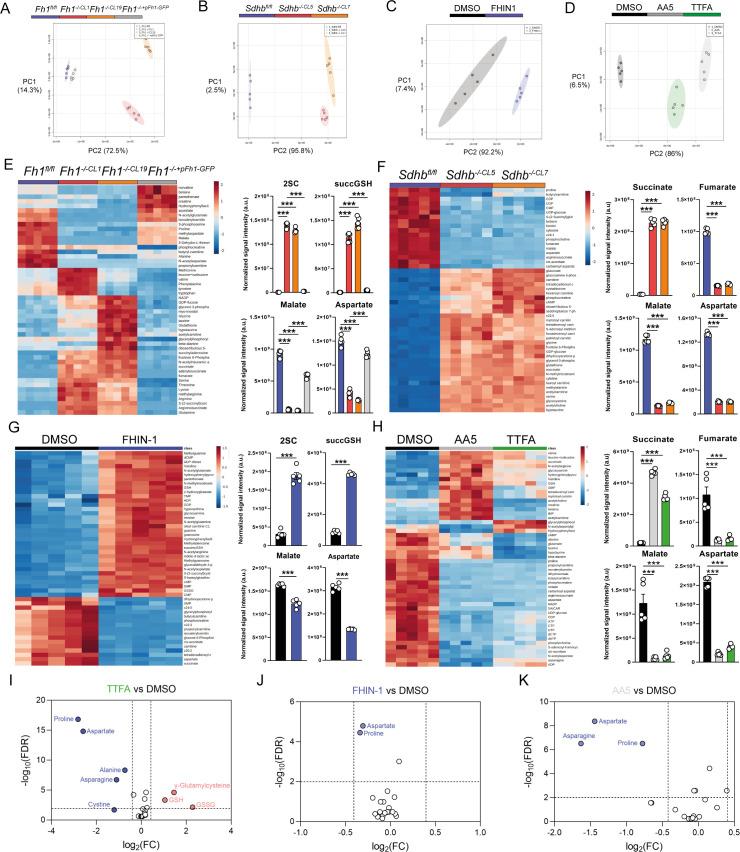
Figure 1—figure supplement 1. Metabolomic analysis of acute and chronic TCA cycle inhibition.

Figure 1—figure supplement 1.

(A) PCA plot of metabolomics data of Fh1fl/fl, Fh1-/-CL1, Fh1-/-CL19 and Fh1-/-CL1+pFh1 cells (n = 5 independent biological replicates). (B) PCA plot of metabolomics data of Sdhbfl/fl, Sdhb-/-CL5 and Sdhb-/-CL7 cells (n = 5 independent biological replicates). (C) PCA plot of DMSO- and FHIN-1 (20 μM)-treated Fh1fl/fl cells (24 h timepoint) (n = 5 independent biological replicates). (D) PCA plot of DMSO-, AA5 (1 μM)- and TTFA (500 μM)-treated Fh1fl/fl cells (24 h timepoint) (n = 5 independent biological replicates). (E) Heatmap of top 50 significant metabolite changes in Fh1fl/fl, Fh1-/-CL1, Fh1-/-CL19 and Fh1-/-CL1+pFh1 cells (n = 5 independent biological replicates) and relative change in Fh1-deficient metabolic markers (S)–2-succinocysteine (2SC), succinicGSH, malate and aspartate (n = 5 independent biological replicates). (F) Heatmap of top 50 significant metabolite changes in Sdhbfl/fl, Sdhb-/-CL5, and Sdhb-/-CL7 cells (n = 5 independent biological replicates) and relative change in Sdh-deficient metabolic markers succinate, fumarate, malate, and aspartate (n = 5 independent biological replicates). (G) Heatmap of top 50 significant metabolite changes in DMSO- and FHIN-1 (20 μM)-treated Fh1fl/fl cells (24 hr timepoint) (n = 5 independent biological replicates) and relative change in Fh1-deficient metabolic markers 2SC, succinicGSH, malate and aspartate (n = 5 independent biological replicates). (H) Heatmap of top 50 significant metabolite changes in DMSO-, AA5 (1 μM)- and TTFA (500 μM)-treated Fh1fl/fl cells (24 hr timepoint) (n = 5 independent biological replicates) and relative change in Sdh-deficient metabolic markers succinate, fumarate, malate, and aspartate (n = 5 independent biological replicates). (E–H) Data are mean ± SEM. p value determined by ordinary one-way ANOVA, corrected for multiple comparisons using Tukey statistical hypothesis testing. p < 0.05*; p < 0.01**; p < 0.001***. (I) Volcano plot of log2 fold change in glutathione-related metabolites and amino acids in TTFA (500 μM)-treated Fh1fl/fl versus DMSO-vehicle control Fh1fl/fl cells (24 hr timepoint) (n = 10 independent biological replicates). (J) Volcano plot of log2 fold change in glutathione-related metabolites and amino acids in FHIN-1 (20 μM)-treated Fh1fl/fl versus DMSO-vehicle control Fh1fl/fl cells (1 hr timepoint) (n = 5 independent biological replicates). (K) Volcano plot of log2 fold change glutathione-related metabolites and amino acids in AA5 (1 μM)-treated Fh1fl/fl versus DMSO-treated Fh1fl/fl cells (1 hr timepoint) (n = 5 independent biological replicates). p value determined by multiple unpaired t-tests, corrected with two-stage step-up method of Benjamini, Krieger, and Yekutieli - FDR = 5%.