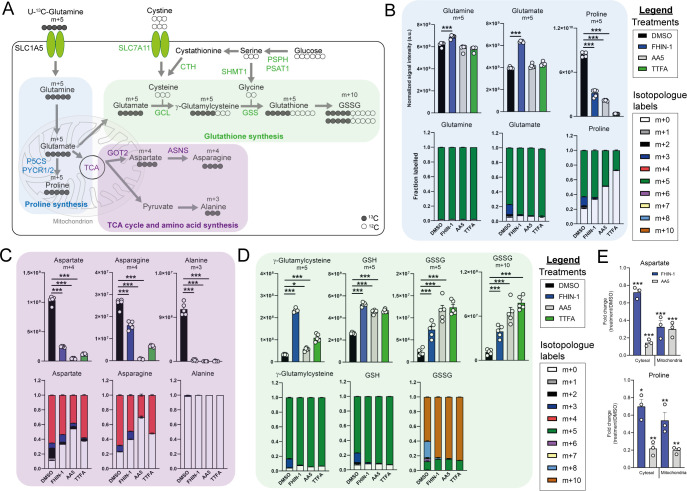
Figure 2. TCA cycle inhibition impairs glutamine-derived proline and aspartate synthesis but promotes cytosolic GSH synthesis.
(A) Schematic diagram highlighting U-13C-glutamine tracing into distinct metabolic modules. (B) U-13C-glutamine tracing into proline (m + 5 labeling intensity and total isotopologue fraction distribution). (C) U-13C-glutamine tracing into aspartate, asparagine and alanine (m + 4 and m + 3 labeling intensity and total isotopologue fraction distribution). (D) U-13C-glutamine tracing into glutathione synthesis pathway (m + 5 and m + 10 labeling intensity and total isotopologue fraction distribution) (B–D) show DMSO, FHIN-1 (20 μM)-, AA5 (1 μM)- and TTFA (500 μM)-treated Fh1fl/fl cells (24 h timepoint) (n = 5 independent biological replicates). Data are mean ± standard error of mean (SEM). p Value determined by ordinary one-way ANOVA, corrected for multiple comparisons using Tukey statistical hypothesis testing. (E) Proline and aspartate level fold change in mitochondrial and cytosol fractions in FHIN-1 and AA5-treated versus DMSO-treated Fh1fl/fl cells (24 h timepoint) (n = 3 independent biological replicates). Data are mean ± standard error of mean (SEM). p Values determined by unpaired two-tailed t-test. p < 0.05*; p < 0.01**; p < 0.001***.


