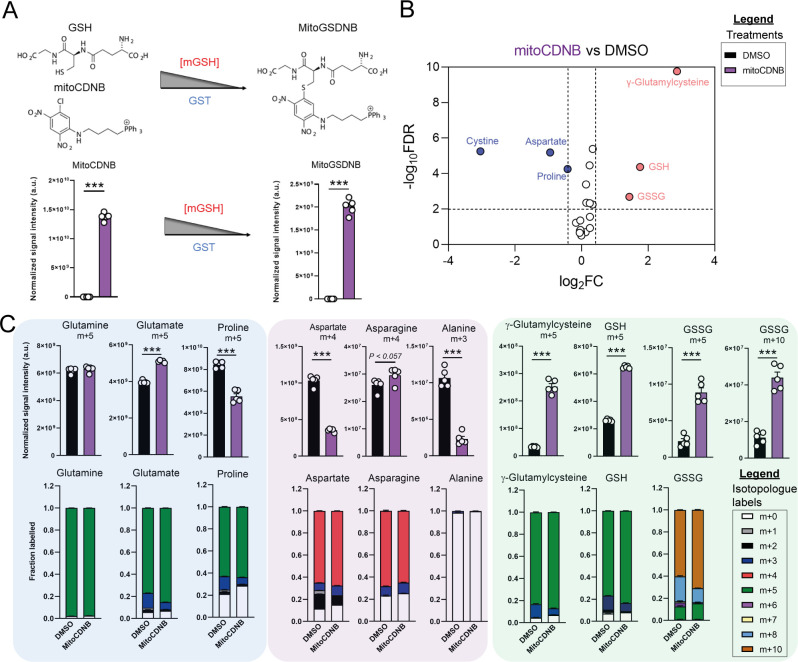
Figure 3. Disrupted mitochondrial thiol redox homeostasis phenocopies TCA cycle inhibition.
(A) Schematic diagram highlighting mito 1-Chloro-2,4-dinitrobenzene (mitoCDNB) reaction with glutathione and the formation of mito 1-S-glutathionyl-2,4-dinitrobenzene (MitoGSDNB) and intensity levels in DMSO-treated and mitoCDNB (10 μM)-treated Fh1fl/fl cells. (B) Volcano plot of glutathione-related metabolites and amino acids in mitoCDNB-treated Fh1fl/fl versus DMSO-treated Fh1fl/fl cells. p Value determined by multiple unpaired t-tests, corrected with two-stage step-up method of Benjamini, Krieger and Yekutieli - FDR = 5%. (C) U-13C-glutamine tracing (m + 10, m + 5, m + 4 and m + 3 labeling intensity and total isotopologue fraction distribution) in DMSO and mitoCDNB-treated Fh1fl/fl cells. (A–C) (24 hr timepoint) (n = 5–10 independent biological replicates). (A and C) Data are mean ± SEM. p Value determined by unpaired two tailed t-test or ordinary one-way ANOVA corrected for multiple comparisons using Tukey statistical hypothesis testing. p < 0.05*; p < 0.01**; p < 0.001***.


