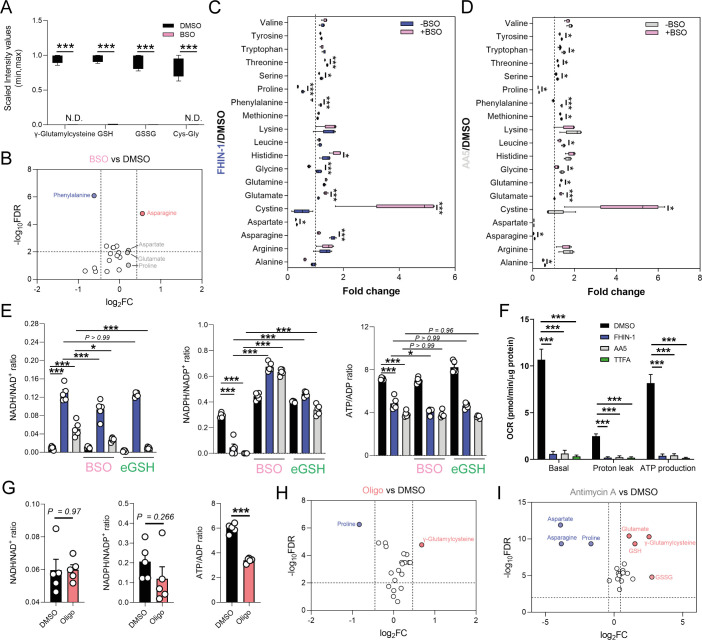
Figure 4. Impaired mitochondrial respiration underlies defect in de novo proline synthesis.
(A) Scaled intensity values of glutathione-related metabolites in BSO (500 μM)-treated and DMSO-treated Fh1fl/fl cells (24 hr timepoint). (B) Volcano plot of amino acids in BSO-treated versus DMSO-treated Fh1fl/fl cells (24 hr timepoint). (C) Interleaved box and whiskers plot of amino acids with FHIN-1-treated or FHIN-1 and BSO co-treatment of Fh1fl/fl cells (24 hr timepoint). (D) Interleaved box and whiskers plot of amino acids with AA5-treated or AA5 and BSO co-treatment of Fh1fl/fl cells. (E) NADH/NAD+, NADPH/NADP+ and ATP/ADP ratio in DMSO, FHIN-1- and AA5-treated Fh1fl/fl cells ± BSO or ethylGSH co-treatment. (F) OCR assessed by Seahorse analyser in DMSO, FHIN-1-, AA5-, and TTFA-treated Fh1fl/fl cells (A–F) (n = 5 independent biological replicates). (E–F) Data are mean ± SEM. p Value determined by ordinary one-way ANOVA, corrected for multiple comparisons using Tukey statistical hypothesis testing. p < 0.05*; p < 0.01**; p < 0.001***. (G) NADH/NAD+, NADPH/NADP+, and ATP/ADP ratio in DMSO and Oligomycin (10 μM)-treated Fh1fl/fl cells (1 hr timepoint). Data are mean ± SEM. p Values determined by unpaired two-tailed t-test. p < 0.05*; p < 0.01**; p < 0.001***. (H) Volcano plot of glutathione-related metabolites and amino acids in Oligomycin-treated versus DMSO-treated Fh1fl/fl cells (1 h timepoint) (G–H) (n = 5 independent biological replicates). (I) Volcano plot of glutathione-related metabolites and amino acids in Antimycin A (2 μM)-treated versus DMSO-treated Fh1fl/fl cells (24 hr timepoint) (n = 5 independent biological replicates). (A-D; H–I) p Value determined by multiple unpaired t-tests, corrected with two-stage step-up method of Benjamini, Krieger, and Yekutieli - FDR = 5%.


