. 2021 Dec 23;10:e72593. doi: 10.7554/eLife.72593

Figure 5. TCA cycle inhibition mimics an amino acid deprivation response and promotes compensatory reprogramming.

(A) GSEA of RNAseq data from FHIN-1- and AA5-treated versus DMSO-treated Fh1fl/fl cells. (B) Quantitative PCR results from FHIN-1-, AA5-, TTFA-, and DMSO-treated Fh1fl/fl cells (24 hr timepoint) (n = 3–5 independent biological replicates). Data are mean ± SEM. p Value determined by unpaired two-tailed t-test or ordinary one-way ANOVA, corrected for multiple comparisons using Tukey statistical hypothesis testing. p < 0.05*; p < 0.01**; p < 0.001***. (C) ORA of overlapping transcripts significantly increased in FHIN-1 and AA5-treated Fh1fl/fl cells and between overlapping proteins significantly increased in FHIN-1 and TTFA-treated Fh1fl/fl cells (24 h timepoint) (n = 3–5 independent biological replicates). Reactome pathways ranked by p value. (D) Comparison of amino acid metabolism and tRNA synthetase transcript and protein levels.

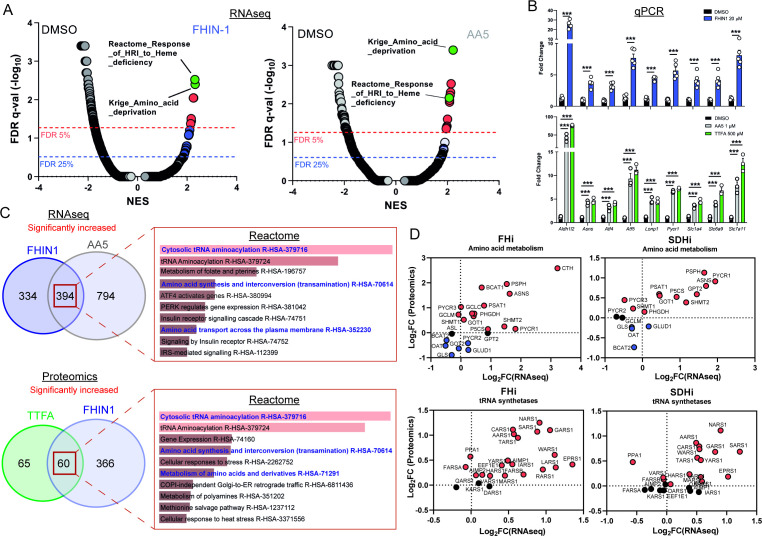
Figure 5.

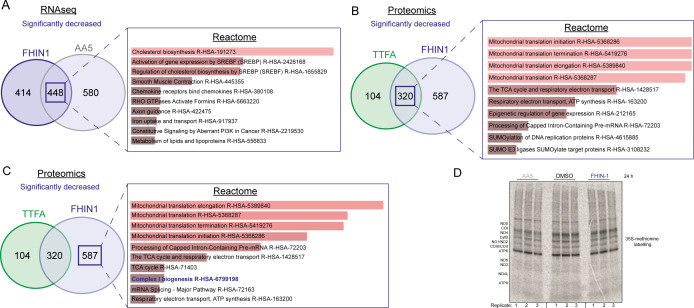
Figure 5—figure supplement 1. Over representation analysis of significantly decreased targets upon acute TCA cycle inhibition.

Figure 5—figure supplement 1.

(A) ORA of overlapping transcripts significantly decreased in FHIN-1 (20 μM)- and AA5 (1 μM)-treated Fh1fl/fl cells (24 h timepoint) (24 h timepoint) (n = 3 independent biological replicates). (B) ORA of overlapping proteins significantly decreased in FHIN-1 and TTFA-treated Fh1fl/fl cells (24 h timepoint) (n = 5 independent biological replicates). (C) ORA of proteins significantly decreased uniquely in FHIN-1-treated Fh1fl/fl cells (24 h timepoint) (n = 5 independent biological replicates).(A–C) Reactome pathways ranked by combined score (p value and Z score). (D) 35S-methionine labeling of mitochondrial translation in DMSO-, FHIN-1 (20 μM)-, and AA5 (1 μM)-treated Fh1fl/fl cells (24 hr timepoint) (n = 3 independent biological replicates).