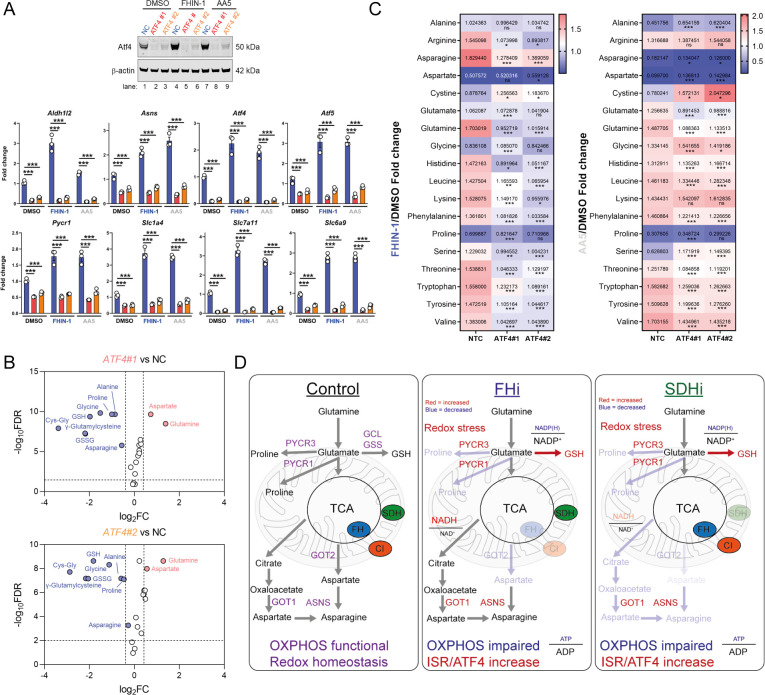
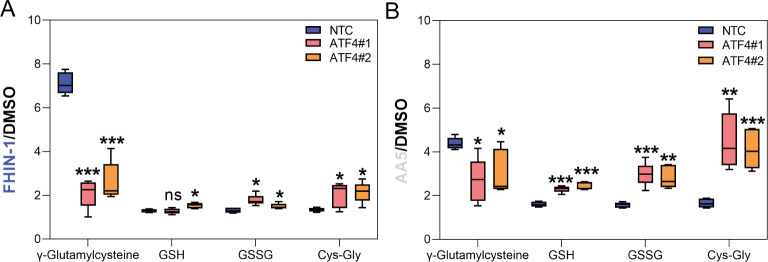
Figure 7. Atf4 regulates amino acid and GSH metabolism.
(A) Western blot analysis of Atf4 and β-actin as loading control (24 hr timepoint) (representative image of 3 independent biological replicates) and qPCR analysis of Atf4-target genes (24 hr timepoint) (n = 3 independent biological replicates) in DMSO-, FHIN-1- and AA5-treated Fh1fl/fl cells with or without siRNA-mediated silencing of Atf4. Data are mean ± SEM. p value determined by ordinary one-way ANOVA, corrected for multiple comparisons using Tukey statistical hypothesis testing. p < 0.05*; p < 0.01**; p < 0.001***. (B) Volcano plot of glutathione-related metabolites and amino acids in Atf4-silenced Fh1fl/fl cells versus non-targeting control (NC)- Fh1fl/fl cells (48 hr timepoint). (C) Heatmap of amino acid levels in FHIN-1- and AA5- versus DMSO-treated Fh1fl/fl cells with or without siRNA-mediated silencing of Atf4 (24 hr timepoint). (B–C) (n = 5 independent biological replicates). (D) Schematic diagram highlighting key findings of the comparative analysis between acute FHi versus SDHi.


