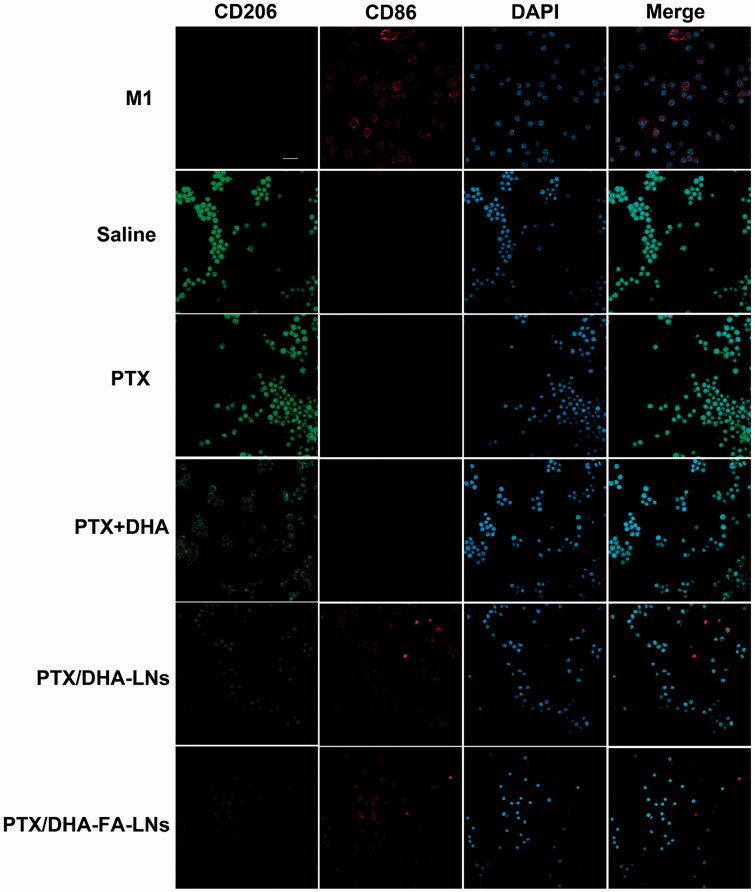
Figure 9.
Confocal laser scanning microscopy images of macrophages after treatment with PBS, PTX, PTX + DHA, PTX/DHA-LNs, and PTX/DHA-FA-LNs. Cell nuclei were stained with DAPI (blue), CD86 fluorescence displayed in red and CD206 fluorescence displayed in green. Scale bar represents 20 μm. Data represent mean ± SD (n = 3).

