. 2021 Dec 15;10:e66955. doi: 10.7554/eLife.66955

Figure 1. Loss of ASE neuron fate upon transient CHE-1 depletion.

(A) The terminal selector gene che-1 induces its own expression and that of 500–1000 target genes that together determine ASE neuron fate. Positive autoregulation of che-1 expression could result in bistable, switch-like behavior. (B) Bistability generates sustained terminal selector expression upon transient induction (1), that is resilient to short periods of terminal selector depletion (2). However, bistable switches remain reversible and will lose terminal selector expression upon sufficiently long depletion (3), while irreversible switches will always recover. (C) Transient CHE-1 depletion using Auxin-Induced Degradation (AID). che-1::GFP::AID L1 larvae (CHE-1::GFP::AID) or young adults (chemotaxis) were exposed for different time periods to 1 mM auxin to induce CHE-1::GFP:AID degradation, and were subsequently characterized after a 24- or 48-hr recovery period. (D) CHE-1::GFP::AID fluorescence in che-1::GFP::AID animals before (left) and after 24 hr auxin treatment (middle), and after a subsequent 24 hr recovery off auxin (right). Even though CHE-1::GFP::AID is lost from ASE neurons after auxin treatment, it reappears after recovery off auxin. (E) Response to 10 mM NaCl for wild-type animals, che-1(p679) mutants defective in NaCl chemotaxis, and che-1::GFP::AID animals exposed to auxin for 24–96 hr (24A – 96A) tested directly (0 R) or after 48 hr recovery (48 R). che-1::GFP::AID animals on auxin showed a chemotaxis defect similar to che-1(p679) mutants. che-1::GFP::AID animals recovered chemotaxis to NaCl after 24 or 48 hr on auxin, but exhibited a persistent chemotaxis defect after sufficiently long, transient CHE-1::GFP::AID depletion. (F) Fraction of animals that recovered CHE-1::GFP::AID expression 48 hr after auxin treatment of increasing length. No animals recovered CHE-1::GFP::AID expression after 120 hr depletion. Error bars in (E) and (F) represent mean of four assays ± S.E.M. *p < 0.05, **p < 0.01, ***p < 0.001, n.s. indicates not significant. In (E) significance is compared to che-1(p679) mutants (black) or che-1::GFP::AID animals without auxin (red).

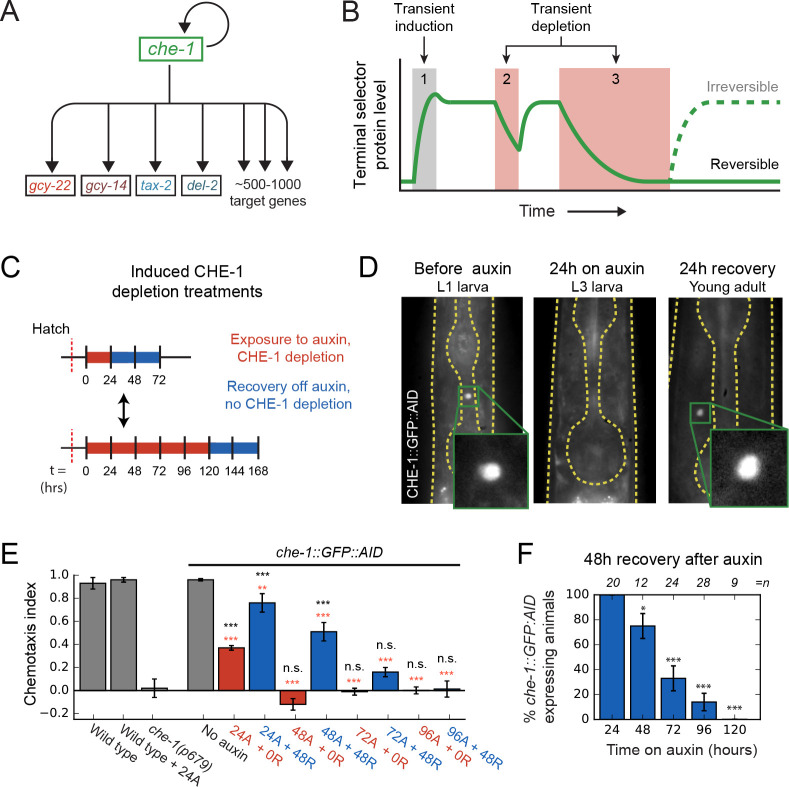
Figure 1—source data 1. Data and scripts for Figure 1 and related figure supplements.

Figure 1.

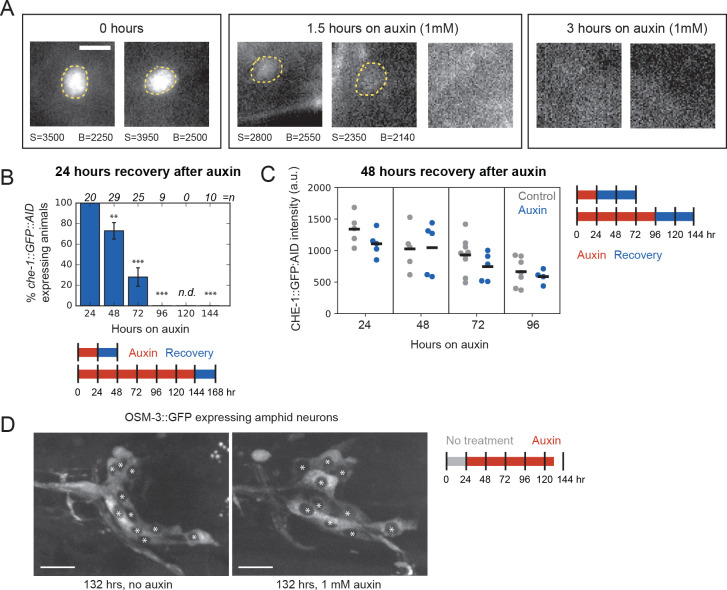
Figure 1—figure supplement 1. CHE-1 recovery after depletion.

Figure 1—figure supplement 1.

(A). Representative images of CHE-1::GFP::AID in animals after different durations of auxin-induced CHE-1::GFP::AID depletion. Dashed circles highlight visible CHE-1::GFP::AID fluorescence. For ASE neurons with visible CHE-1::GFP::AID fluorescence, S and B denote the fluorescence signal within the dashed circles and the background outside, respectively (arbitrary units). For animals after 1.5 hr on auxin, CHE-1::GFP::AID fluorescence was much reduced, when visible, while for animals 3 hr on auxin no CHE-1::GFP::AID was visible and the fluorescence signal at the expected location of the ASE neuron is shown instead. Overall, 15/15 control animals showed visible CHE-1::GFP::AID, compared to 2/10 and 0/7 animals after 1.5 and 3 hr exposure to auxin, respectively, indicating that auxin-mediated CHE-1::GFP::AID depletion was rapid. Scalebar: 3 μm. (B) Percentage of animals that recovered CHE-1::GFP::AID expression after auxin treatment of increasing length with a recovery period of 24 hr. Schematics indicate the range of times and durations of auxin treatment. **p < 0.01, ***p < 0.001, and n.d. indicates not determined. (C) CHE-1::GFP::AID fluorescence intensity in animals that recovered CHE-1::GFP::AID after 24–96 hr of auxin-induced degradation, compared to control animals of the same age that were not exposed to auxin. In animals that recovered CHE-1::GFP::AID after transient depletion, fluorescence levels returned to similar values as control animals, indicating that CHE-1::GFP::AID recovery was complete. (D) Representative images of OSM-3::GFP expression in che-1::GFP::AID animals after 132 hr or no auxin exposure. Asterisks indicate the amphid neurons on one side of the animal expressing OSM-3::GFP. Animals in which CHE-1::GFP::AID was depleted showed the same number of OSM-3::GFP expressing amphid neurons, indicating that CHE-1::GFP::AID depletion did not cause apoptosis of the ASE neurons. Scalebar: 10 μm.

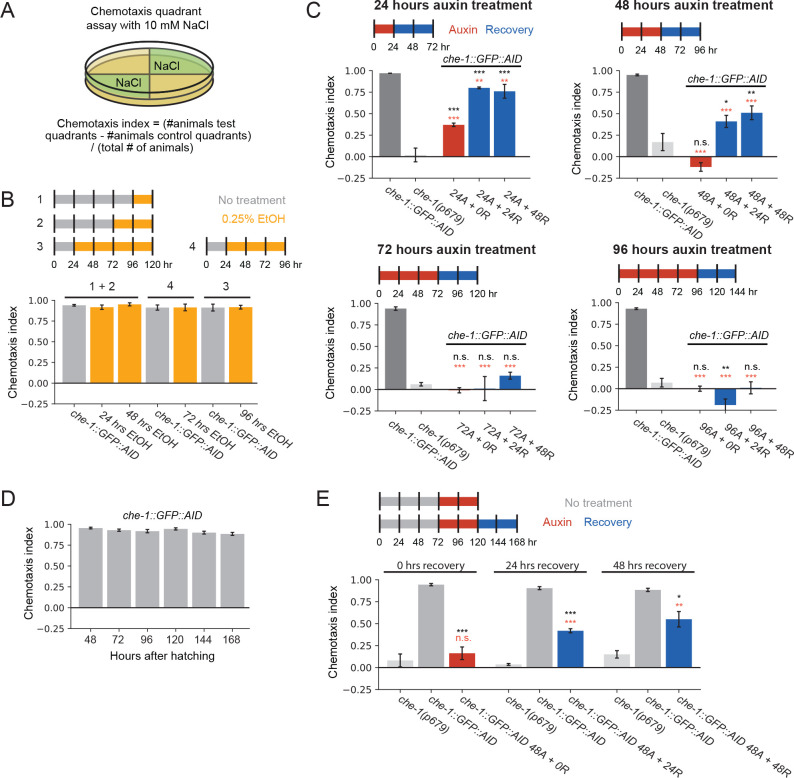
Figure 1—figure supplement 2. CHE-1 depletion and NaCl chemotaxis.

Figure 1—figure supplement 2.

(A) Schematic of quadrant chemotaxis assay and chemotaxis index (CI) calculation for chemotaxis to NaCl. (B) Chemotaxis index of che-1::GFP::AID animals exposed to 0.25% EtOH for different durations. As auxin is dissolved in 100% EtOH, auxin treatments occurred at ~0.25% EtOH. These controls show that exposure to 0.25% EtOH does not impact NaCl chemotaxis. Schematics indicate timing and duration of exposure to EtOH. (C) Chemotaxis index of che-1::GFP::AID animals without auxin, che-1(p679) and che-1::GFP::AID animals exposed to auxin for 24–96 hr followed by a recovery period of 0, 24 or 48 hr. Auxin treatment was started in early L1 larvae. Schematics indicate the duration of auxin treatment. Control experiments followed the same protocol but were not exposed to auxin. (D) Chemotaxis index for response to 10 mM NaCl of che-1::GFP::AID animals without auxin, for different times after hatching. Quality of NaCl chemotaxis does not deteriorate with age at least until 168 hr after hatching. (E) Same as (C) but for animals that were 72 hr old at the start of auxin treatment. Older animals showed similar ability to recover from transient CHE-1::GFP::AID depletion as young animals. In (C) and (E), *p < 0.05, **p < 0.01, ***p < 0.001 compared to che-1(p679) mutants (black) or che-1::GFP::AID animals without auxin (red), while n.s. indicates not significant.