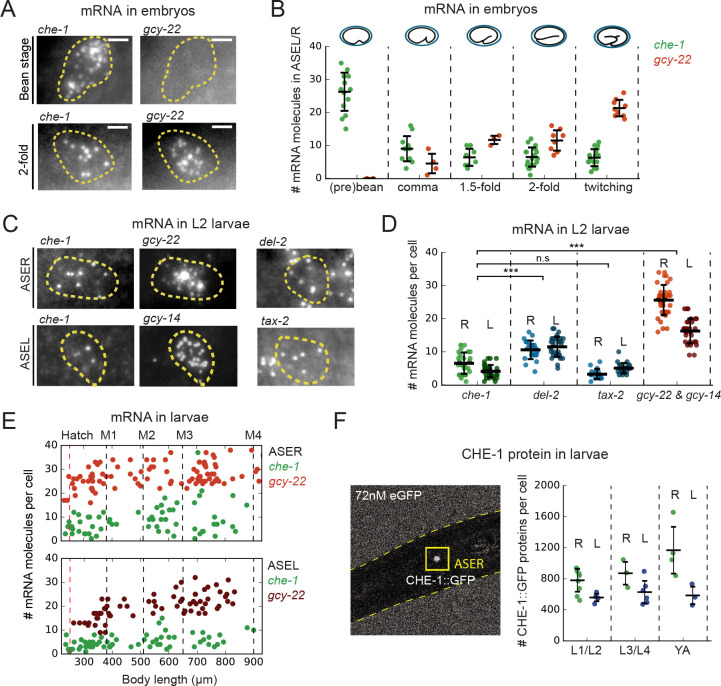
Figure 2. che-1 mRNA and protein copy numbers in ASE neurons.
(A) Expression of che-1 and the CHE-1 target gcy-22 in embryos at the bean (top) and 2-fold stage (bottom). Each spot is a single mRNA molecule visualized by single molecule FISH (smFISH). Dashed lines outline ASE neuron cell bodies. Scale bar: 2 μm. (B) che-1 (green) and gcy-22 (red) mRNA levels during embryonic development. che-1 expression peaks during specification, but falls as expression of CHE-1 target genes rise. (C) Expression of che-1 and CHE-1 targets gcy-22, gcy-14, tax-2 and del-2 visualized by smFISH in L2 larvae. Dashed lines outline left and right ASE neurons (ASEL/R). Scalebar: 2 μm. (D) Quantification of expression of che-1 and CHE-1 targets in ASEL (L) and ASER (R) in L2 larvae. che-1 mRNA levels are low compared to other CHE-1 target genes. (E) Low che-1 expression (green, ASER/L) compared to expression of CHE-1 targets gcy-22 (red, ASER) and gcy-14 (red, ASEL) throughout larval development. Body length corresponds to developmental time, with approximate timing of hatching and molts between larval stages L1-L4 indicated by vertical lines. (F) Left panel: two-photon microscopy image of L2 larva expressing endogenously-tagged CHE-1::GFP, immersed in 72 nM eGFP for calibration. Right panel: CHE-1::GFP protein molecules in ASER (green), (R) and ASEL (blue), (L) at different stages of post-embryonic development. The number of CHE-1 proteins is comparable to the predicted number of CHE-1-binding sites. Error bars in B, D, and F represent mean ± SD. ***p < 0.001.


